4 Results
Data in this report come from hospitals including large ACHs, CAHs that have less than 25 beds, LTAC facilities where patients typically stay greater than 10 days and require hospital-level care, and specialty hospitals such as women’s, children’s, and psychiatric. This report also includes data from IRFs that consist of both free-standing buildings (N=20) and CMS designated locations within large acute care hospitals (N=66).
NHSN required that all hospitals and IRFs complete an annual survey to report on general information regarding the previous year. In Pennsylvania, 322 facilities completed a 2018 survey in NHSN. Two of the 322 facilities were not open for the entire year and were, therefore, excluded from this report.
Table 1 shows the number of facilities used in the analysis for each type of facililty, HAI and corresponding SUR, CDI and MRSA LabID event metric. Most hospitals that completed the annual NHSN survey reported device days and LabID events. Most of the ACHs that didn’t report device days were inpatient behavioral treatment centers with mental health and addiction programs. LabID events were not routinely reported among children’s hospitals, CAHs, and psychiatric hospitals because guidance from Department of Health states that those facilities are not required to report LabID events.
Table 1: Number of Hospitals that Reported Data for Each of the Metrics | Pennsylvania, 2018
| Hospital Type | Hospital Surveys | CAUTI SIR | Urinary Catheter Days | CLABSI SIR | Central Line Days | MRSA Bloodstream Infection SIR | CDI SIR |
|---|---|---|---|---|---|---|---|
| Acute | 167 | 162 | 162 | 162 | 162 | 164 | 164 |
| Crit. acc. | 16 | 16 | 16 | 16 | 16 | 0 | 0 |
| Children’s | 5 | 5 | 5 | 5 | 5 | 0 | 0 |
| LT acute | 21 | 21 | 21 | 21 | 21 | 21 | 21 |
| Psych. | 29 | 11 | 11 | 7 | 5 | 0 | 0 |
| Rehab. | 86 | 76 | 76 | 76 | 76 | 76 | 76 |
| Total | 324 | 291 | 291 | 287 | 285 | 261 | 261 |
4.1 CAUTIs
4.1.1 SIR
In 2018, 1,339 CAUTIs were reported from 291 hospitals. This is 233 fewer CAUTIs than predicted using the 2015 national baseline data (N = 1,572, SIR:0.852; 95% CI: (0.81, 0.90)) and 111 fewer CAUTIs than 2017. This SIR is statistically significantly lower than the 2015 national baseline SIR.
Of the 10 hospitals with the greatest number of predicted infections only one had lower statistically significant SIR than the 2015 national baseline. The SIRs from the other 9 hospitals were not statistically significantly different from the 2015 national baseline data. Together these nine hospitals had 461 CAUTIs. This is one-third of all CAUTIs in the state but only 28% of the number predicted infections in the whole state were predicted to come from these hospitals. Cumulatively, these nine hospitals had 19 fewer CAUTIs than in 2017, but half of these hospitals had more CAUTIs in 2018 than in 2017.
To reach the 2020 HHS goal of a 25% reduction in CAUTIs from the number that were predicted to occur in 2015, Pennsylvania hospitals need to prevent an additional 160 infections. The nine hospitals mentioned above need to prevent 114 infections (66% of 160) collectively to reach HHS goal within their individual hospitals.
As displayed in Table 2, the majority of CAUTIs occurred in ACHs (1,148 of 1,339). Overall, the ACHs performed 18% better than hospitals from the 2015 national baseline (SIR 0.82, 95% CI: (0.77, 0.87)). On the other hand, the CAUTI SIR was statistically significantly higher than the 2015 national baseline in LTAC hospitals (SIR: 1.32, 95% CI: (1.06, 1.63)). Twenty more CAUTIs occurred in LTAC hospitals than predicted. In IRFs and children’s hospitals, 3 and 4 more CAUTIs, respectively, occurred than were predicted from the 2015 national baseline. Whereas CAHs and psychiatric hospitals had 3 and 2 fewer CAUTIs, respectively, than predicted.
Table 2: Summary of CAUTI Measures Stratified by Hospital Type | Pennsylvania, 2018
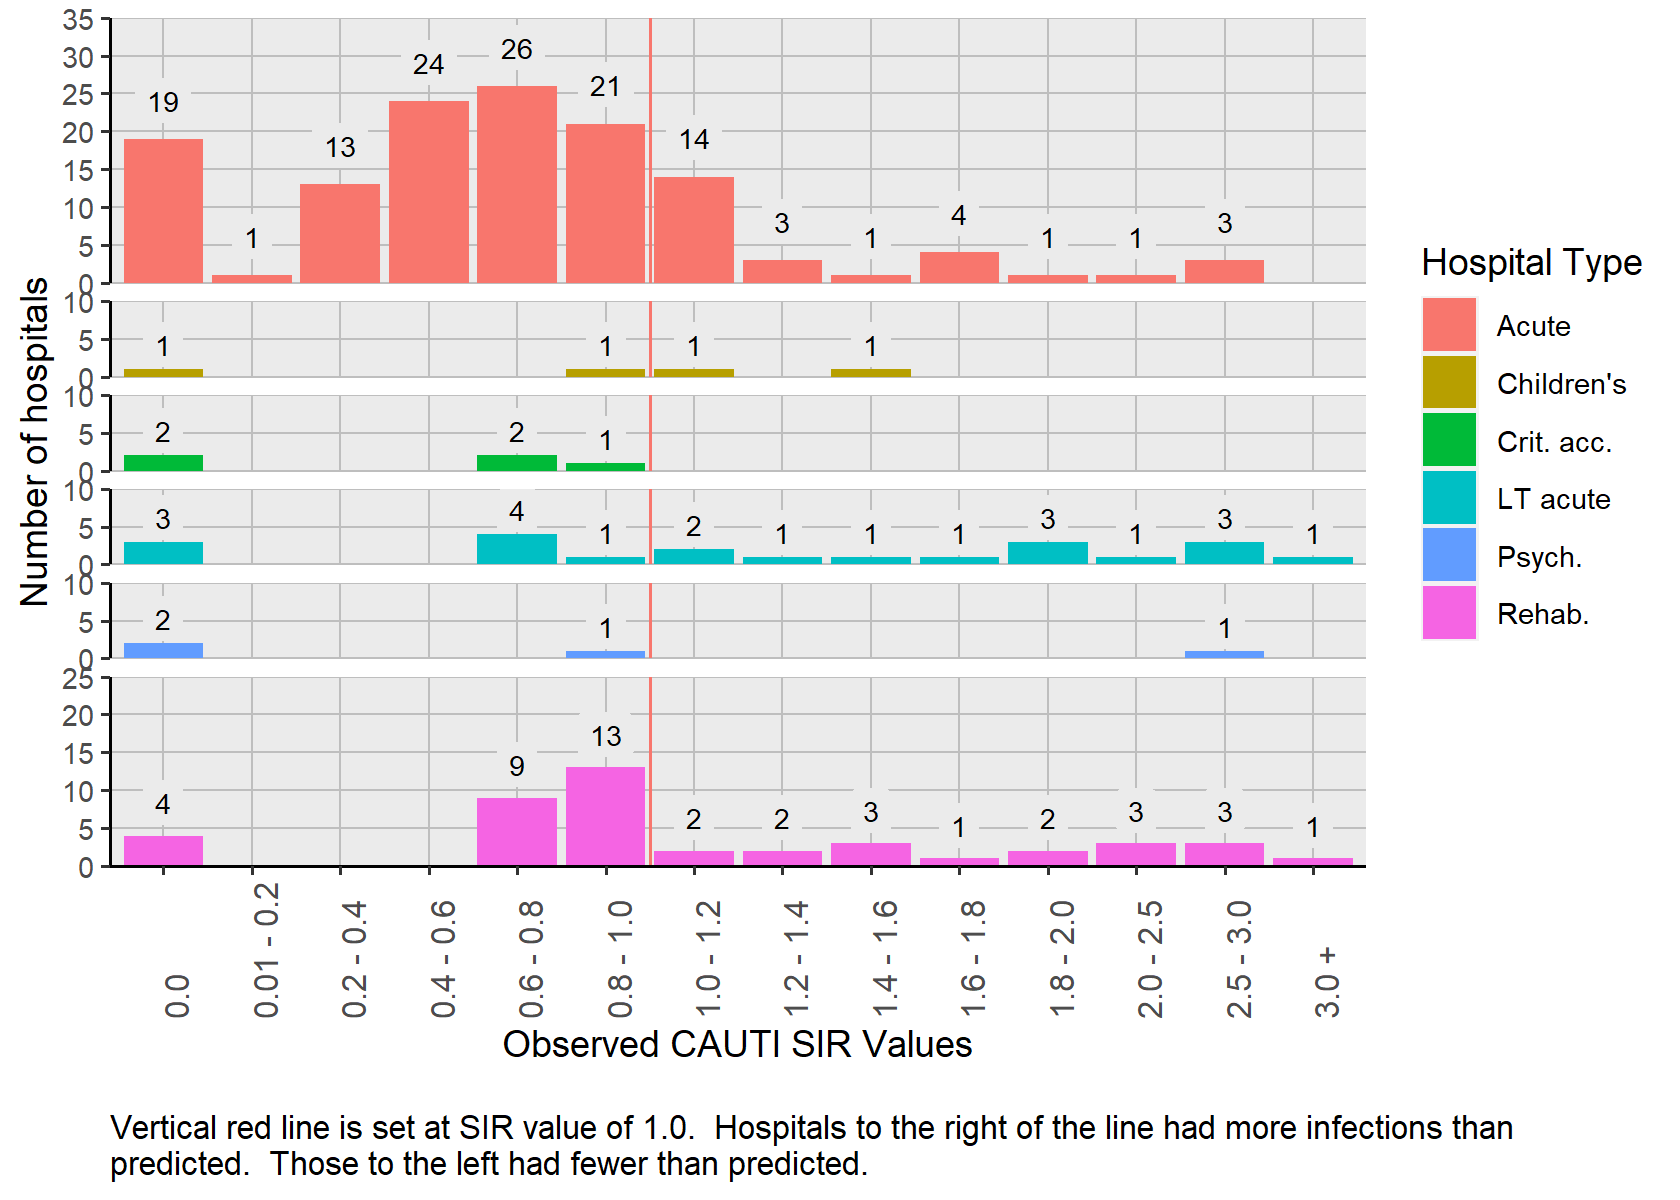
Figure 1 displays the distribution of hospital specific SIRs (N= 208) grouped by hospital type. The hospital specific CAUTI SIR values were dispersed and ranged from 0 to 3.83. This includes 163 hospitals in which a SIR calculated with 2018 data and 45 hospitals with 2017 and 2018 data combined. Despite the inclusion of two years of surveillance data, 83 (29 percent) hospitals had less than one predicted infection and relatively few urinary catheter days. CAUTIs occurred in 22 (27 percent) of those hospitals and SIRs were not calculated because the number of predicted infections was less than 1.0.
4.1.1.1 Distribution
Figure 1: Distribution of CAUTI SIRs by Hospital Type | Pennsylvania 2017-2018 and 2018
4.1.1.2 Hospital List
Table 3 lists the 291 hospitals and relevant CAUTI data, as well as the county where the hospital is located and year(s) from which the data were based. Thirty-one hospitals (10.6%) had SIRs of zero, meaning that no CAUTIs occurred and more than one was predicted. The corresponding predicted number of CAUTIs ranged between 1.0 and 4.7
Seventeen hospitals (identified by blue font) had statistically significantly fewer CAUTIs than were predicted in the 2015 national baseline, meaning that their SIR was less than 1.0. Three of these hospitals reported no infections, although the predicted number of infections ranged between 3.7 and 4.7. Among the remaining eight hospitals where at least one CAUTI occurred, the range of predicted CAUTIs was 8.3 to 51.8.
Eleven hospitals (identified by red font) had statistically significant more CAUTIs than were predicted in the 2015 national baseline, meaning that their SIR was more than 1.0. Eight of these hospitals had less than five predicted CAUTIs.
Table 3: List of Hospitals with CAUTI SIRs and Associated Measures | Pennsylvania 2017-2018 and 2018
Hospitals printed in red have statistically significantly more CAUTIs than predicted. Hospitals printed in blue have statistically significantly fewer CAUTIs than predicted.
4.1.2 Urinary Catheter SUR
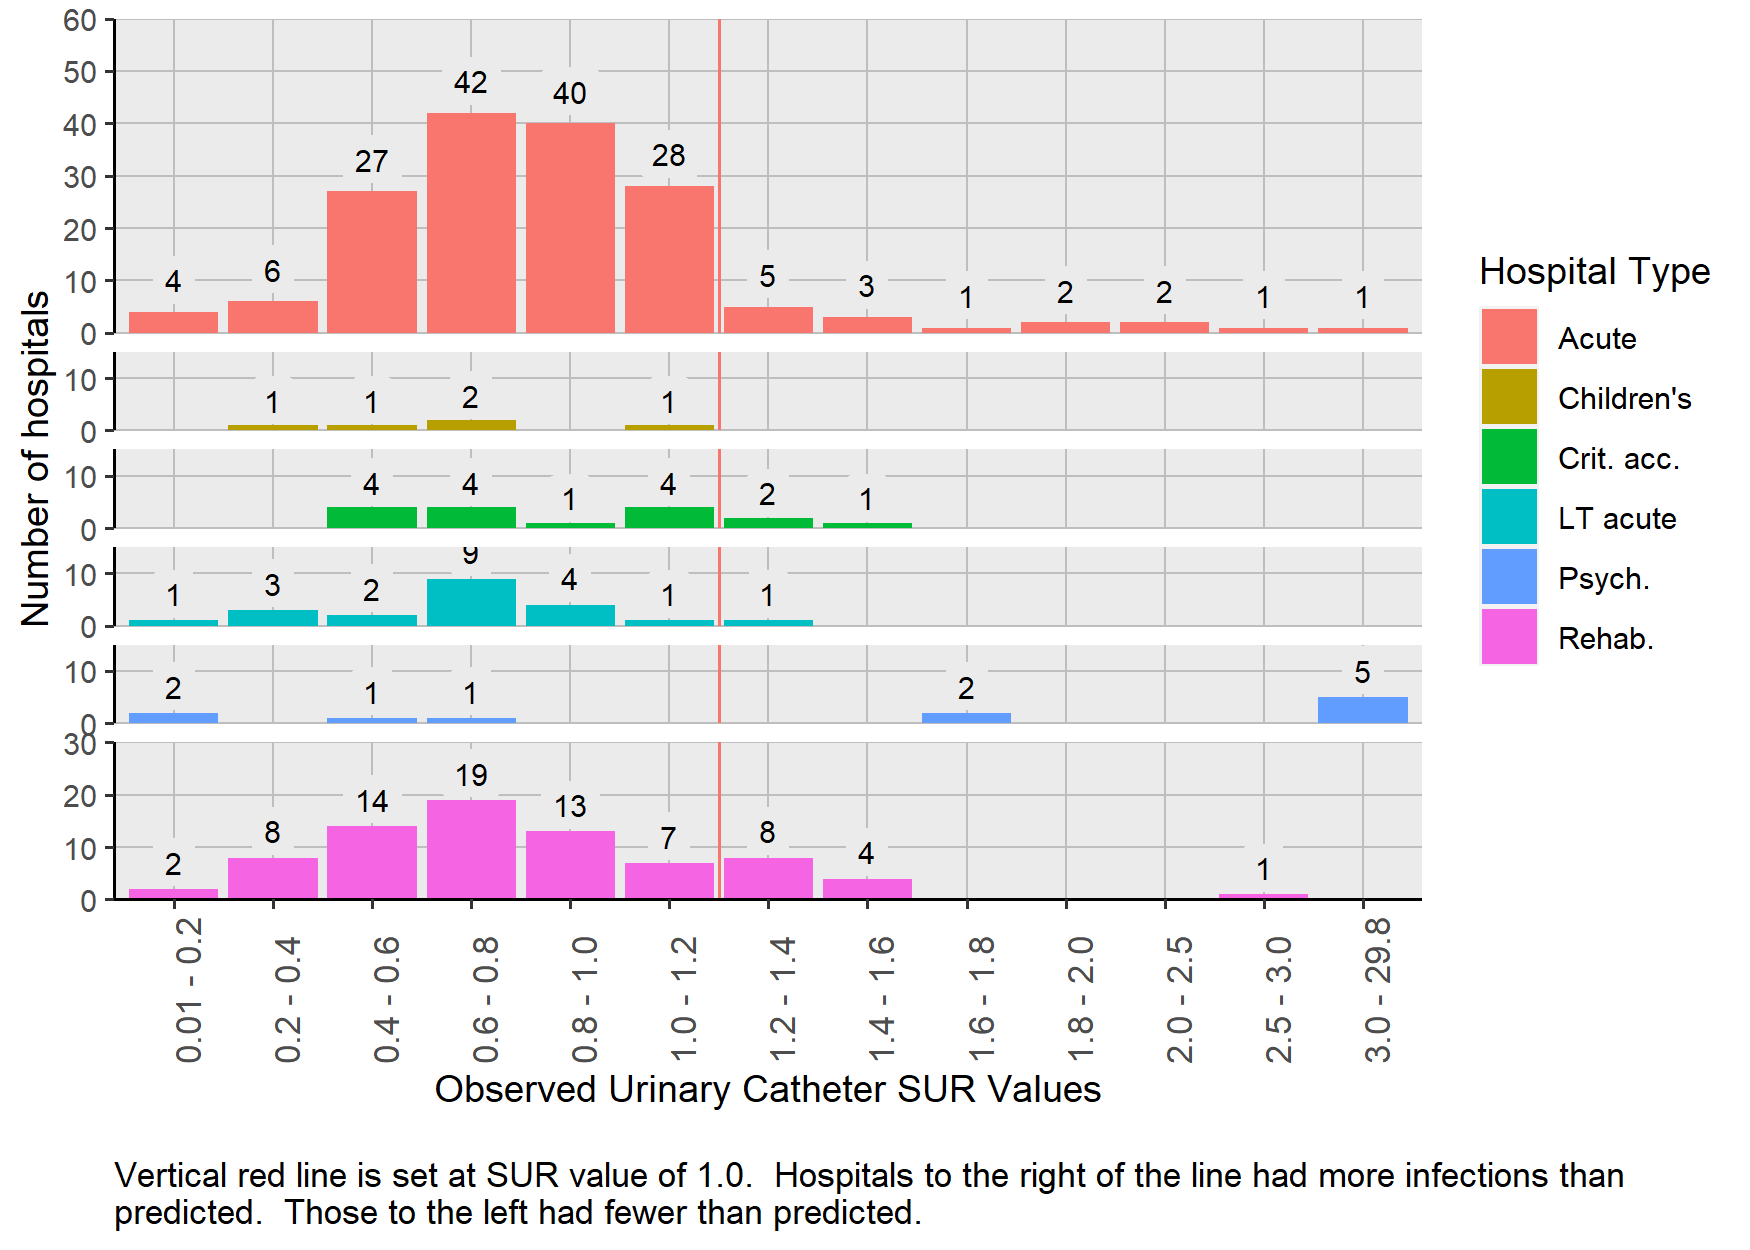
The urinary catheter SUR for Pennsylvania is 0.81 (95%CI: (0.81, 0.81)). This is 19% lower than the 2015 national baseline. The urinary catheter SUR was calculated for 291 facilities. 48 hospitals reported between 1 and 200 urinary catheter days, 79 reported between 201 and 1,000 urinary catheter days, 88 reported between 1,001 and 5,000 urinary catheter days, 35 hospitals reported between 5,001 and 10,000 urinary catheter days, and the remaining 41 reported more than 10,001 urinary catheter days. All hospitals had more than 1.0 predicted urinary catheter day and had a SUR calculated from 2018 data.
4.1.2.1 Hospital Type
Table 4 lists the SUR, reported and predicted urinary catheter use days for different types of hospitals. Psychiatric hospitals in Pennsylvania, as a group, use urinary catheters 1.53 times more often than similar hospitals from the 2015 national baseline (95% CI: (1.47, 1.59)).
Table 4: Urinary Catheters SURs by Hospital Type | Pennsylvania, 2018
4.1.2.2 Distribution
Figure 2 shows that the hospital-specific urinary catheter SUR values were dispersed and ranged from 0 to 29.8. Two hundred sixteen (73%) of the 291 hospitals had SURs less than 1.0. Five psychiatric hospitals (38%) had SURs more than 4.0 (SUR: 29.8, 19.8, 11.4, 7.9, and 4.1), meaning that urinary catheters were used four times greater than those of similar hospitals from the 2015 national baseline. The distribution of SURs in psychiatric hospitals is unique because 23% percent (N=3) had no urinary catheter use.
Figure 2: Distribution of Urinary Catheter SURs by Hospital Type | Pennsylvania 2018
4.1.2.3 Hospital List
Table 5 shows the actual and predicted number of urinary catheter days, SURs and 95% confidence intervals for each hospital.
Table 5: List of Hospitals with Urinary Catheter SURs by Hospital Name | Pennsylvania 2018
Hospitals printed in red have statistically significantly more urinary catheter days than predicted. Hospitals printed in blue have statistically significantly fewer urinary catheter days than predicted.
4.2 CLABSI
4.2.1 SIR
In 2018, 1,074 CLABSIs were reported from 287 hospitals. Statistically, this was significantly lower than the 2015 national baseline (N = 1,424, SIR: 0.754; 95% CI: (0.71, 0.80)). The number of reported CLABSIs in 2018 is 350 fewer CLABSIs than predicted using the 2015 national baseline data and 81 fewer than 2017.
Of the 10 hospitals with the greatest number of predicted infections six have SIRs that are not statistically significantly different from 1.0. This means that there is not a statistically significant difference in the number of CLABSI (N=400) as predicted by similar hospitals from the 2015 national baseline (N=392). These six hospitals contributed 38.4% of all the CLABSIs in the commonwealth and had 33 more CLABSIs than in 2017. Only one of these six hospitals had fewer CLABSIs in 2018 compared to 2017.
To reach the 2020 HHS goal of a 50% reduction in CLABSIs, an additional 362 infections need to be prevented throughout the commonwealth. Collectively, the six hospitals mentioned above need to prevent 213 infections to reach the HHS goal.
4.2.2 Hospital Type
As seen below in Table 6, the majority of CLABSIs occurred in ACHs. Overall, the ACHs performed 31% better than hospitals from the 2015 national baseline (SIR , 95% CI: ). Children’s hospitals had 20 more CLABSIs and LTAC hospitals had 1 more CLABSI occur than were predicted from the 2015 national baseline. Twenty four CLABSIs occurred in IRFs and 22.9 were predicted. Two CLABSIs occurred in CAHs and 1.2 were predicted.
Table 6: Summary of CLABSI Measures Stratified by Hospital Type | Pennsylvania, 2018
4.2.2.1 Distribution
Figure 3 displays the distribution of hospital specific CLABSI SIRs (N=157) grouped by hospital type. This includes 136 hospitals in which a SIR was calculated with 2018 data and 21 hospitals with 2017 and 2018 data combined. Despite the inclusion of two years of surveillance data, 115 (72%) hospitals had less than one predicted infection and relatively few central lines days (maximum = 3,468) compared to hospitals in which at least one infection was predicted. Forty-three CLABSIs occurred in 30 (69.8%) of those hospitals, and SIRs were not calculated because the number of predicted infections was less than 1.0. Hospital specific SIRs were not calculated for CAHs because the number of predicted CLABSIs were less than 1.0.
Figure 3: Distribution of CLABSI SIRs by Hospital Type | Pennsylvania 2017-2018 and 2018

4.2.2.2 Hospital List
Table 7 lists CLABSI data, as well as county location of hospital and year(s) from which the data were based from 273 hospitals.
Thirty-four hospitals had SIRs of zero even though the number of predicted CLABSIs ranged between 1.0 and 5.5. Twenty-six hospitals (identified by blue font) had statistically significant SIRs that were less than 1.0, meaning that they had fewer CLABSIs than in the 2015 national baseline. Six of these hospitals had no infections, although the predicted number of infections ranged between 3.6 and 5.5. Among the remaining 17 hospitals, where at least one CAUTI occurred, the range of predicted CAUTIs was 4.9 to 91.3.
Only five hospitals (identified by red font) had statistically significant SIRs that were more than 1.0, meaning that they had more CLABSIs compared to the 2015 national baseline. Together these hospitals contributed 81 CLABSIs.
Table 7: List of Hospitals with CLABSI SIRs and Associated Measures | Pennsylvania 2017-2018 and 2018
Hospitals printed in red have statistically significantly more CLABSIs than predicted. Hospitals printed in blue have statistically significantly fewer CLABSIs than predicted.
4.2.3 Central Line SUR
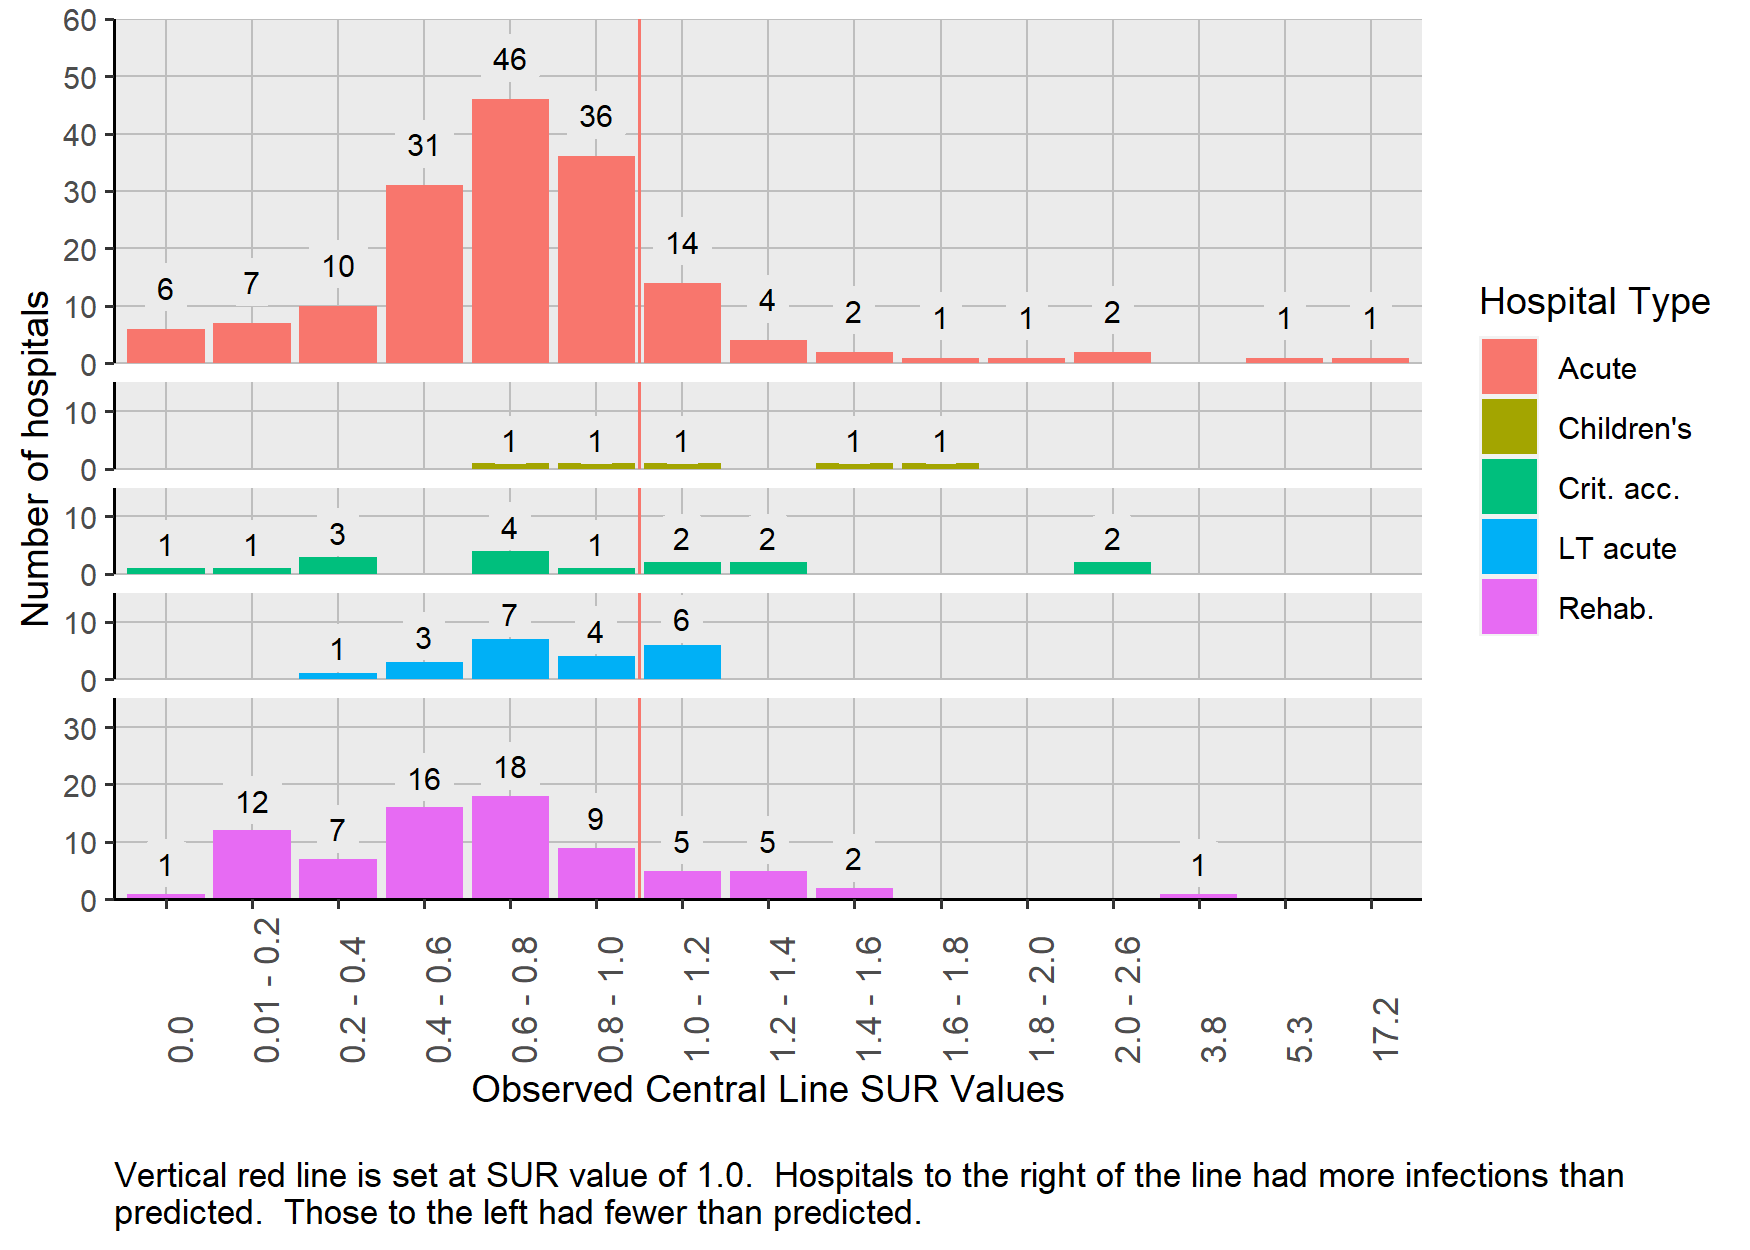
Central lines days were reported from 285 hospitals. Central lines were rarely used in psychiatric hospitals and CAHs because patients in those facilities typically do not present with medical conditions that require monitoring with a central line or these patients are transferred to an acute care hospital after placement of a central line.
The central line SUR was calculated for all the facilities that reported data. The state SUR was 0.83 (95%CI: (0.83, 0.83)) which is 19% less use than predicted by the 2015 national baseline. In 2017 the SUR was 0.85 (95% CI: 0.85-0.85).
Twelve hospitals reported no central line days, 57 hospitals reported between 1 and 200 central line days, 63 reported between 201 and 1,000 central line days, 91 reported between 1,001 and 5,000 central line days, 33 hospitals reported between 5,001 and 10,000 central line days, and the remaining 29 reported more than 10,001 central line days. All hospitals had more than 5 predicted central line days and had a SUR calculated from 2018 data.
4.2.3.1 Hospital Type
Table 8 lists actual and predicted central line days and SURs stratified by hospital type. Central line catheters were most frequently used in ACHs (1,163,880) All hospitals use central line catheters less frequently than predicted by the 2015 national baseline. Children’s hospitals and CAHs used central lines less frequently than in 2017 (SUR = 1.01 and 1.14 respectively).
Table 8 lists summary statistics regarding central line use in different types of hospitals.
Table 8: Central line SURs by Hospital Type | Pennsylvania, 2018
4.2.3.2 Distribution
Figure 4 shows that the hospital-specific central line SUR values were dispersed and ranged from zero to 17.22. Two hundred nine (81.1%) of the 285 hospitals had SURs less than 1.0. Five hospitals had SURs more than 2.0. Collectively, these five hospitals reported 74 CLABSIs.
Figure 4: Distribution of Central Line SURs by Hospital Type | Pennsylvania 2018
4.2.3.3 Hospital List
Table 9 shows that the number of predicted central line days in hospitals ranged from 5.9 to 72,337.0, and the observed use ranged from zero to 55,750. Examination of the hospitals with the highest 10 SURs shows that all but 1 had less than 2,000 predicted central line days.
Table 9: List of Hospitals with Central Line SURs by Hospital Name | Pennsylvania 2017-2018 and 2018
Hospitals printed in red have statistically significantly more central line days than predicted. Hospitals printed in blue have statistically significantly fewer central line days than predicted.
4.3 SSIs
4.3.1 Description of Surgical Procedures
This 2018 report includes HAIs that occurred following seven surgical procedure types: three types of cardiac surgery, hip and knee replacements, abdominal hysterectomy, and colon surgery. After applying the exclusion criteria, a total of 167,222 surgical procedures were performed and followed for signs of a surgical site infection (SSI) in 169 hospitals during 2018. As a reminder, patients who had surgical procedures but did not spend the night in the hospital were excluded because this type of procedure was classified as an outpatient procedure, not an inpatient procedure.
Table 10 shows that 57 hospitals perform all seven surgeries. Table 11 shows the number of surgeries included in this report that were performed at each hospital for each surgical procedure type in 2018.
Table 10: SSI SIRs for each of Seven Procedures | Pennsylvania, 2018
| Number of Hospitals | Abdominal Hysterectomy | Cardiac Surgery | CBG Surgery 1 incision | CBG Surgery 2 incisions | Colon | Hip Replacement | Knee Replacement |
|---|---|---|---|---|---|---|---|
| 60 | X | X | X | X | |||
| 57 | X | X | X | X | X | X | X |
| 15 | X | X | X | ||||
| 9 | X | X | |||||
| 7 | X | X | X | X | X | ||
| 4 | X | X | X | ||||
| 4 | X | ||||||
| 3 | X | X | |||||
| 2 | X | X | |||||
| 2 | X | X | |||||
| 2 | X | X | X | X | X | X | |
| 1 | X | ||||||
| 1 | X | ||||||
| 1 | X | X | X | ||||
| 1 | X | X | X | X |
Table 11: Number of surgeries performed at each hospital | Pennsylvania, 2018
4.3.2 SIRs
As mentioned in the Methods chapter of this report, the NHSN protocol sets forth two different methods to evaluate SSIs, which are referred to as “all” and “complex”. Results presented in this section contain metrics using the “complex” model definition, which includes only deep tissue and organ space SSIs. (SSI results that use the “all” case definition are presented in Appendix A.) Superficial infections are not counted as cases in the “complex” model. For a more detailed description of the complex case definition and adjustment models, please refer to the SIR Guide Supplement42.
4.3.3 State SSI SIRs
Table 12 shows the number of surgeries performed in 2018, number of SSIs, number of predicted infections and respective SIRs for each surgical procedure. Knee replacement surgeries are the most commonly performed surgeries reported in NHSN with 42,309 performed during 2018. CBG with two incisions and CBG with one incision were only performed in acute care hospitals.
SSI SIRs for all seven monitored surgical procedures range between 0.76 and 1.1. The state-wide SSI SIRs for colon surgeries and abdominal hysterectomies are statistically significantly lower than the 2015 national baseline (Colon: SIR: 0.82, 95% CI: (0.73, 0.91), Hysterectomy: SIR: 0.76, 95% CI: (0.59, 0.98)). SIRs for the five other surgical procedures are close to 1.0 and not statistically different than the 2015 national baseline.
To reach the 2020 HHS goal of a 30% reduction (SIR = 0.70) in colon SSIs, an additional 49 colon SSIs need to be prevented. To reach the same goal in abdominal hysterectomy SSIs, an additional 5 infections need to be prevented.
Table 12: SSI SIRs for each of seven procedures | Pennsylvania, 2018
4.3.4 Hospital Type
Because nearly all surgical procedures were performed in acute care hospitals, calculation of 2018 SSI SIRs stratified by hospital type is very limited. Only four surgical type and hospital type pairs had more than one predicted SSI. These are presented in Table 13 below.
None of the surgeries performed in these settings had statistically significant SIRs differed from the 2015 national baseline, although the SIR for hip replacement surgery was elevated (SIR: 1.66).
Table 13: SIRs from Surgical-Procedure Combinations Commonly Performed in Specific Hospital Types | Pennsylvania, 2018
4.3.5 Distribution
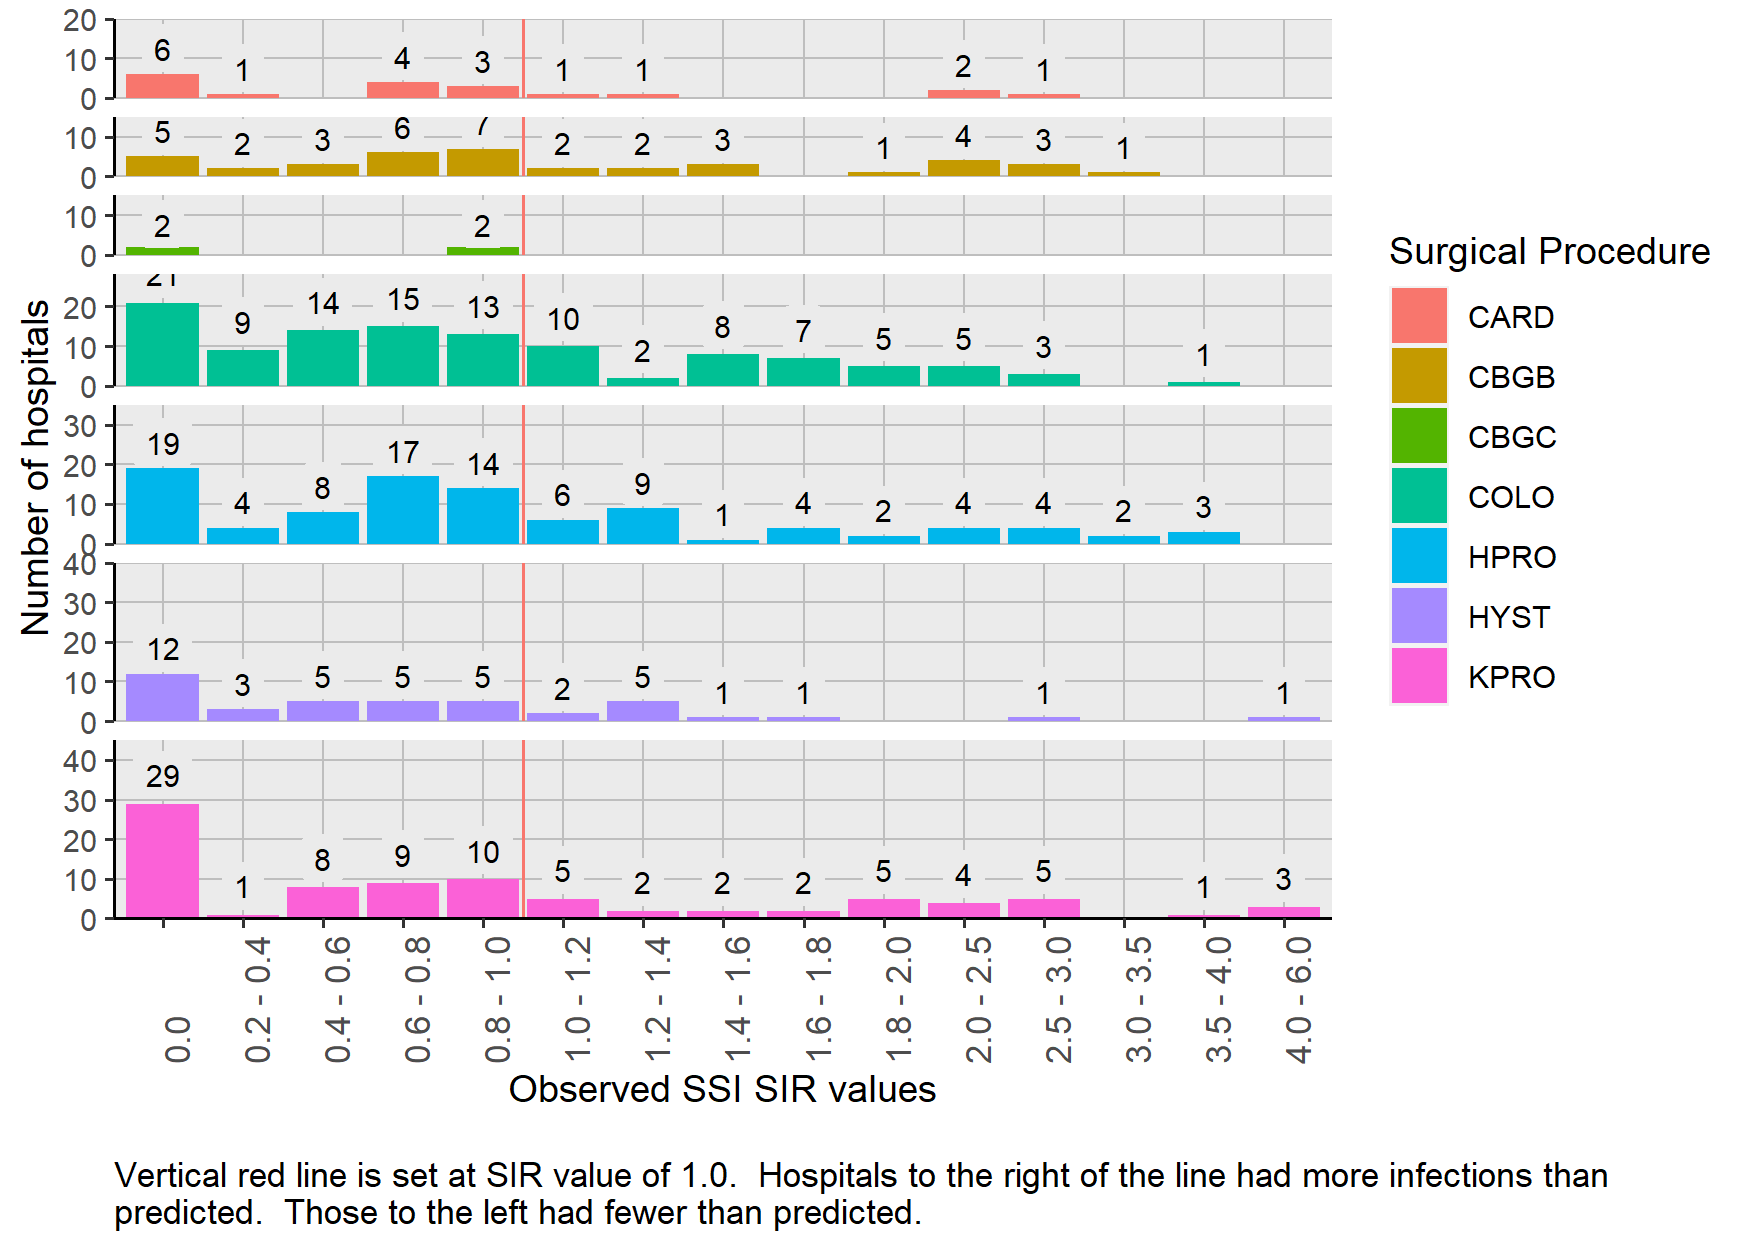
The distribution of 2018 and 2017-2018 SIRs for the seven surgery types is presented in Figure 5. Because the SIR was calculated in those hospitals in which the predicted number of infections was 1.0 or more for either timeframe, 399 hospital-procedure pairs are included. This includes only 9 hospital surgery pairs from children’s hospitals. The remaining SIRs are from acute care hospitals. Forty-eight (12%) of the SIRs were 2.0 or larger.
Figure 5: Distribution of SIRs Stratified by Surgical Procedure Type| Pennsylvania, 2017-2018 and 2018
4.3.6 Statistically Significant SSI SIRs
Table 14 shows the number of hospitals with statistically significant SSIs. Nearly three times as many hospitals have statistically significantly higher SIRs than those with SIRs statistically significantly lower SIRs. Of the four surgical procedures, colon procedures had the most facilities (n=5) with SIRs that were statistically significantly less than the 2015 national baseline. No hospitals had significantly fewer SSIs than the 2015 national baseline for all remaining benchmarked surgeries. Five hospitals that performed abdominal hysterectomies and knee replacement surgeries had SIRs that were statistically significantly more than the 2015 national baseline for these procedures.
Table 14: Number of hospitals with statistically significant SSI SIRs | Pennsylvania, 2017-2018 and 2018
4.3.7 Hospital List
Table 15 displays the comprehensive list of all hospital-surgical procedure pairs in which one or more of the surgeries was performed during 2018 (N= 788). The SIR was calculated for 200 hospital surgery pairs (25.4% of 788) when the predicted number of infections was more than 1.0 in 2018. An additional 105 SIRs (13.3%) could be calculated when 2017 and 2018 data were combined. The remaining 483 hospital surgery pairs (61.3%) had less than 1.0 predicted infections and SIRs could not be calculated. One hundred-three (21.3%) of those pairs had one or more SSIs occur even though less than 1.0 was predicted.
Table 15: Hospitals that Perform Seven Types of Surgeries and their SSI SIRs and Associated Measures | Pennsylvania, 2017-2018 and 2018
Hospitals printed in red have statistically significantly more SSIs than predicted. Hospitals printed in blue have statistically significantly fewer SSIs than predicted.
4.4 C. difficile Infections
CDI LabID events are the most common type of reported events in this report. In 2018, 4,005 CDI events occurred, and 5,096 were predicted from the 2015 national baseline. This reflects the fact that all people admitted to a hospital are at risk to get a CDI and each day in the hospital increases the chance of getting a CDI26. This was 631 fewer infections than occurred in 2017 and 1,091 fewer than predicted.
The CDI SIR was 0.79 (95% CI: (0.76, 0.81)) , which means that the number of CDI cases was 21% lower compared to the 2015 national baseline. To reach the 2020 HHS goal of a 30% reduction (SIR = 0.70) in CDI events, an additional -438 CDIs need to be prevented.
Of the 10 hospitals with the largest predicted number of CDIs, six had SIRs that were statistically significantly more than or not different from the number of predicted CDIs using the 2015 national baseline. These six hospitals contributed 878 CDIs in 2018 and collectively need to prevent 313 CDI LabID events to reach the 2020 HHS goal. This is -71% of the number of CDIs need to be prevented in the entire state.
4.4.1 Hospital Type
As shown in Table 16, most (91%) CDI events occurred in acute care hospitals and the SIR was 0.79 (95%CI: (0.77, 0.82)). This means that CDI events in 2018 were 21% lower in acute care hospitals than in the 2015 national baseline. Departmental guidance states that children’s, CAH and psychiatric hospitals are not required to report LabID events. The data reported here do not reflect CDI events from those facilities.
The SIR in IRFs was 0.67 (95% CI:(0.58, 0.77)). IRFs had 99 fewer CDI events than predicted by the 2015 national baseline. The SIR in LTAC hospitals was 0.83 (95% CI:(0.70, 0.97)). LTAC hospitals had 30 fewer CDI events than predicted by the 2015 national baseline.
Table 16: C. difficile Infection Event SIRs by Hospital Type | Pennsylvania, 2018
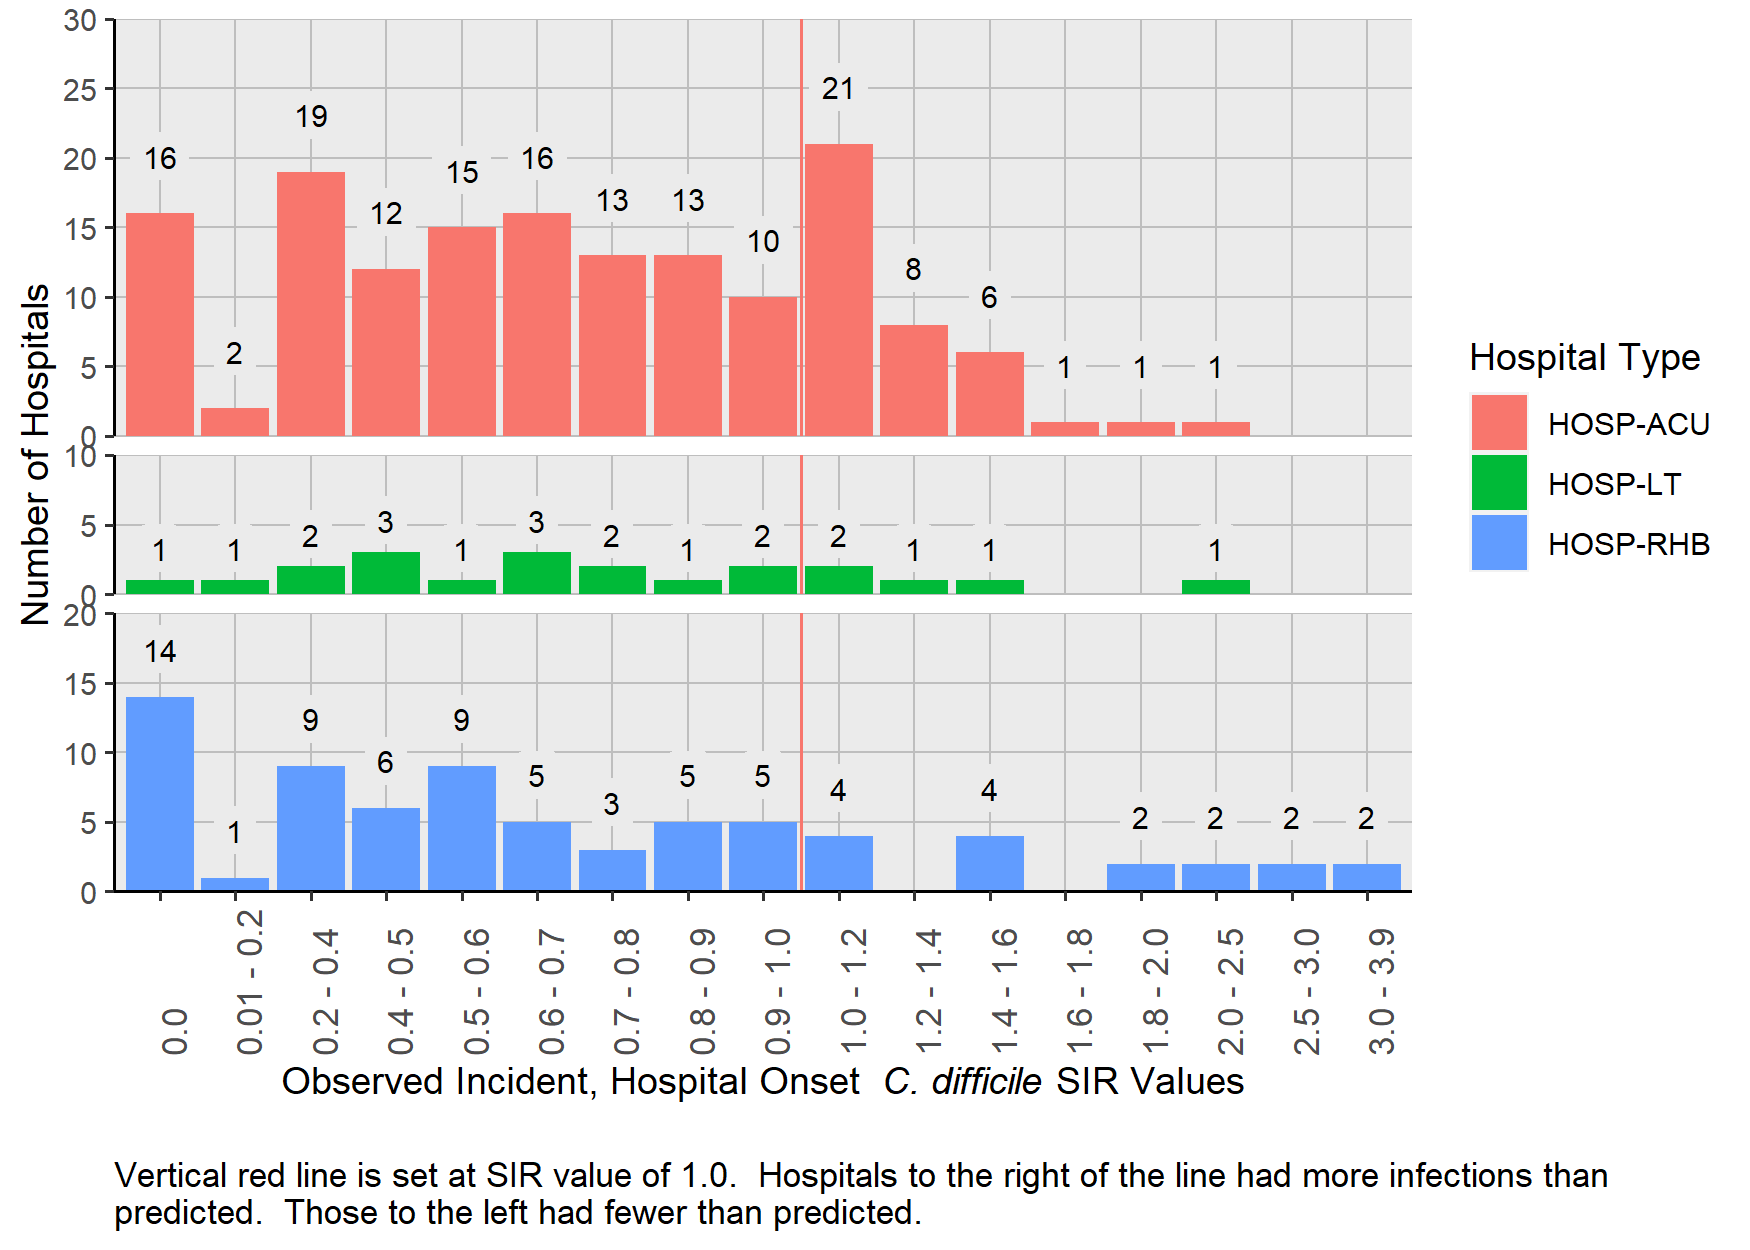
4.4.2 Distribution
Figure 6 shows the distribution of CDI SIRs for ACH, LTAC hospitals, and IRFs among hospitals with a SIR. Because so few CDI event data were reported from individual children’s hospitals, CAHs, and psychiatric hospitals, their data are not shown. This figure includes 227 hospitals in which a SIR was calculated using 2018 data and 21 hospitals with 2017 and 2018 data combined. Only dim(no_sir)[1] (5%) of hospitals had less than 1.0 predicted infection. Only three CDI events occurred in those hospitals.
The SIRs among the 248 hospitals ranged from zero to 3.8. The distribution among the 154 ACH shows that most SIRs (75.3%) were less than 1.0. The low number of LTAC hospitals with SIRs less than 0.6 demonstrates challenges in preventing CDI events. Seventy eight percent (N=57 of IRFs had a SIR less than 1.0, and six IRFs had SIRs more than 2.0.
Figure 6: Distribution of C. difficile SIRs Stratified by Hospital Type| Pennsylvania, 2017-2018 and 2018
4.4.3 Hospital List
Table 17 shows the patients at risk for CDI, number of CDI events and SIR for each Pennsylvania hospital that reported data (N=261). This also displays the type of CDI test that the hospital used for the full 2018 calendar year. The statistical models adjust for type of CDI test that was performed for each quarter of the year. The CDI test is not a factor that can explain differences between SIRs. The display of CDI test type used by hospitals is included in this table as a courtesy for facilities to evaluate CDI test methods used by their peers.
Thirty-three hospitals had SIRs of zero, even though the number of predicted CDI events ranged between 1.0 and 7.1. Sixty-two hospitals (identified by blue font) had statistically significant SIRs that were less than 1.0, meaning that they had fewer CDI events than predicted by the 2015 national baseline. Six of these hospitals had no CDI events, although the predicted number ranged between 4.1 and 7.1. Among the remaining 56 hospitals where at least one CDI event occurred, the range of predicted CDIs was 5.2 to 152.3. Eight hospitals had statistically significant elevated SIRs, meaning that more CDI events occurred than predicted during the 2015 national baseline. The SIRs ranged from 1.18 to 3.19.
Table 17: List of Hospitals with C. difficile Infection Event SIRs by Hospital Name | Pennsylvania 2017-2018 and 2018
Hospitals printed in red have statistically significantly more CDI events than predicted. Hospitals printed in blue have statistically significantly fewer CDI events than predicted.
4.5 MRSA Blood Infections
In 2018, 341 MRSA bloodstream events occurred and 501 were predicted from the 2015 national baseline. This results in a SIR of 0.68 (95% CI:(0.61, 0.76)). Departmental guidance states that children’s, CAHs, and psychiatric hospitals are not required to report MRSA blood LabID events. The data reported here do not fully reflect MRSA bloodstream events from those facilities.
Of the 10 facilities with the most predicted infections had SIRs seven were not statistically significantly lower than 1.0. These seven hospitals reported 95 MRSA LabID events.
To reach the 2020 HHS goal of a 50% reduction (SIR = 0.50) in MRSA LabID events, an additional 90 infections need to be prevented. The seven facilities mentioned above need to prevent 37 MRSA LabID events to meet the 2020 HHS goal. This is 41.1% of the total number of MRSA LabID events needed to be prevented in the entire state.
4.5.1 Hospital Type
Table 18 lists patient days at risk, number of predicted and observed MRSA LabID events, and the SIRs for ACH, LTAC hospitals, and IRFs (n = 261). ACHs had statistically significantly fewer MRSA LabID events predicted (SIR: 0.66, 95% CI: (0.59, 0.74)).
LTAC hospitals had about 2.5 fewer MRSA LabID events than predicted by the 2015 national baseline (SIR: 0.9, 95% CI: (0.58, 1.33)). IRFs had about the same number MRSA LabID events than predicted by the 2015 national baseline (SIR: 1.03, 95% CI: (0.57, 1.72)).
Table 18: MRSA Blood Infections SIRs by Hospital Type | Pennsylvania, 2018
4.5.2 Distribution
Figure 7 shows the distribution of MRSA LabID SIRs for ACHs, LTAC hospitals, and IRFs. This figure includes 106 hospitals in which a SIR was calculated with 2018 data and 25 hospitals with 2017 and 2018 data combined. Despite the inclusion of two years of surveillance data, 130 (38.1%) hospitals had less than 1.0 predicted infection. Thirty-one MRSA bloodstream infection events occurred in 34 of those hospitals.
The SIRs among 131 hospitals shown in Figure 7 ranged from zero to 3.31 The distribution of SIRs is wide. The distribution among the ACH shows that most SIRs (N= 89, 81.7%) were less than 1.0.
Figure 7: Distribution of MRSA Blood Infection SIRs Stratified by Hospital Type| Pennsylvania, 2017-2018 and 2018

4.5.2.1 Hospital List
Table 19 includes 261 hospitals from all facilities that submitted data. Forty-three hospitals had SIRs of zero, and the number of predicted MRSA LabID events ranged between 1.0 and 8.5. Ten hospitals (identified by blue font) had statistically significant SIRs that were less than 1.0, meaning that they had fewer MRSA events than in the 2015 national baseline. Three of these hospitals had no MRSA LabID events. Two hospitals had statistically significant SIRs more than 1.0, meaning that more MRSA LabID events occurred than predicted during the 2015 national baseline.
Table 19: List of Hospitals with MRSA Blood Infection SIRs by Hospital Name | Pennsylvania 2018
Hospitals printed in red have statistically significantly more urinary catheter days than predicted. Hospitals printed in blue have statistically significantly fewer urinary catheter days than predicted.