Appendix A
SSI SIRs (Superficial and Deep Tissue)
The NHSN protocol defines 2 different definitions for SSIs: “all” and “complex” This appendix contains metrics using the “all” definition, which includes superficial, deep tissue, and organ space SSIs. For a more detailed description of the “all” case definition and adjustment models, please refer to the SIR Guide Supplement.39 HHS does not set a 2020 reduction goal for this classification of SSIs.
State SIRs by Surgery Type
Table A.1 shows the number of hospitals and surgeries performed and included in the analysis, number of SSIs, number of predicted infections, and respective SIRs for each surgical procedure. Note that the number of surgeries performed is slightly different than those displayed in Chapter 4, Table 12. Surgeries were excluded from this analysis if one or more risk factor variables were missing. Because the all and complex models contain different risk factors that are included in the statistical model and these risk factors have different completion rates, the number of procedures excluded differs also.
SSI SIRs for each of the 7 monitored surgical procedures ranged between 0.71 and 0.95. The state-wide SSI SIR for colon surgeries was statistically significantly lower than the 2015 national baseline (SIR: 0.71, 95% CI: 0.66-0.77). The state-wide SSIs SIR for abdominal hysterectomy surgeries and knee replacements were also statistically significantly lower than the 2015 national baseline (SIR: 0.75, 95% CI: 0.64-0.88, SIR: 0.76, 95% CI: 0.66-0.87).The state-wide SIR for hip replacement was close to 1.0 and not statistically significant (SIR: 0.95, 95% CI: 0.84-1.06), whereas SIRs for the 3 types of cardiac surgeries were each less than 1.0 and not statistically significant (Cardiac SIR 0.89, CBG with 2 incisions SIR 0.86, CBG with 1 incision SIR: 0.79).
Table A1: Superficial, Deep Tissue and Organ Space SSI SIRs for each of 7 Procedures | Pennsylvania, 2017
5.0.1 Hospital Type
Because nearly all surgical procedures were performed in ACHs, calculation of SSI SIRs stratification by hospital type is limited. Only 6 surgical types and hospital type pairs had more than 1.0 predicted SSI, and these are presented in Table A.2 below.
Colon and hip replacement surgeries performed in CAHs had the highest SIRs (2.26 and 2.15, respectively). However, only less than 2 infections (1.8 and 1.9 respectively) were predicted. No infections following abdominal hysterectomy occurred in CAHs. Colon and cardiac surgeries at children’s hospitals each resulted in 5 fewer SSIs than were predicted (Colon SIR 0.61, Cardiac SIR: 0.49). One SIR in Table A.2 reached statistical significance.
Table A2: SIRs from Surgical-Procedure Combinations Commonly Performed in Specific Hospital Types | Pennsylvania, 2017
5.0.2 Distribution
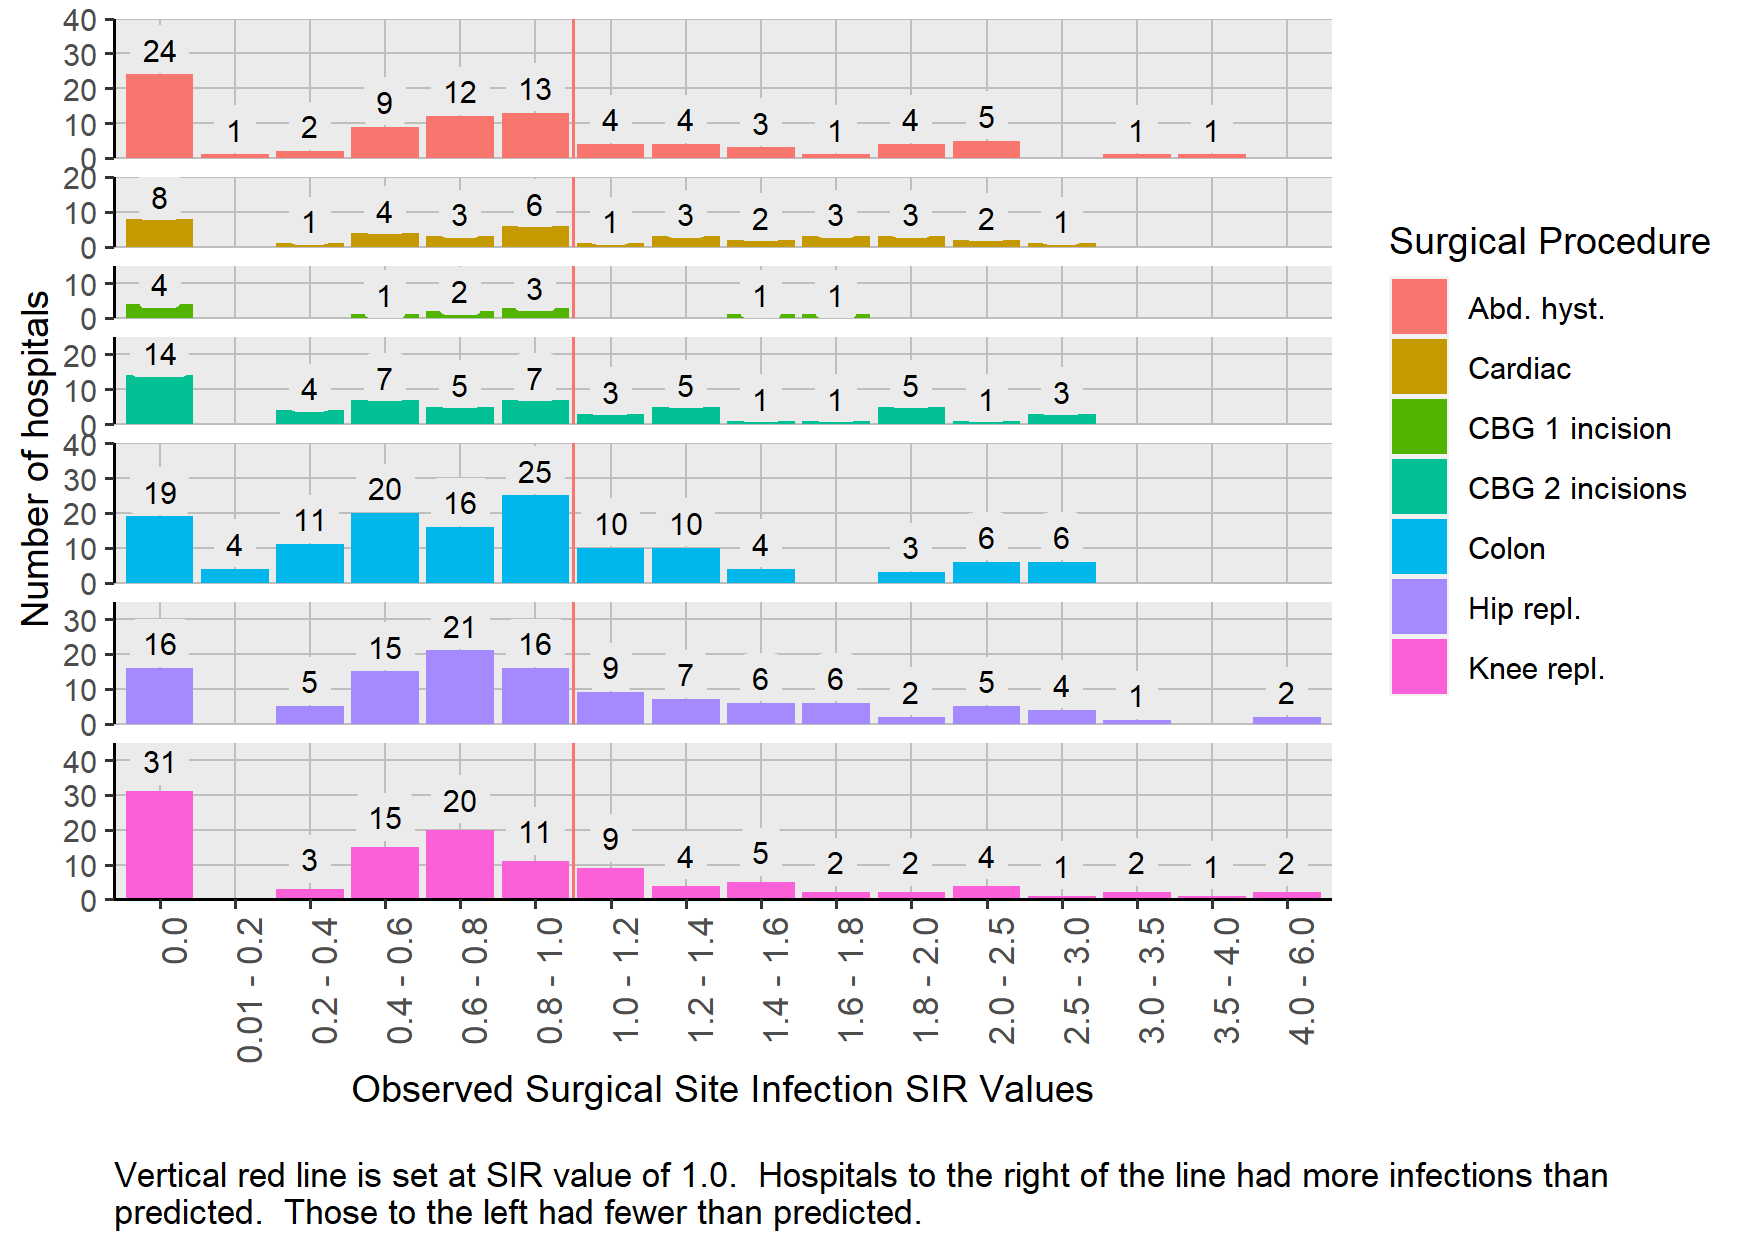
The distribution of 2017 and 2016-2017 SIRs for the 7 surgery types is presented in Figure A.1. The SIR was calculated in those hospitals in which the predicted number of infections was 1.0 or more for either timeframe, resulting in the inclusion of 550 hospital-procedure pairs. This includes only 5 hospital surgery pairs from children’s hospitals and 8 from CAHs. The remaining SIRs are from ACHs.
The shape of the distribution of 2017 and 2016-2017 SIRs for colon surgery, hip and knee replacement, and abdominal hysterectomy SSIs are similar. These 4 surgical procedure types have a substantial number of SIRS equal to 0.0, with the most hospitals’ SIRs between 0.4 and 1.0.
The shape of the distributions of cardiac procedures looks different than those from colon surgery, hip and knee replacement, and abdominal hysterectomy because these procedures are not as commonly performed and fewer HAIs were predicted.
Figure A.1: Distribution of SSI SIRs Stratified by Surgical Procedure Type| Pennsylvania, 2016-2017 and 2017
5.0.3 Statistically Significant SIRs
Table A.3 shows the number of hospitals with statistically significant SSIs. It is noteworthy that 17 hospitals that performed colon surgeries had statistically significant lower SIRs compared with the 2015 national benchmark. More hospitals that performed hip replacement, knee replacement, and abdominal hysterectomy procedures had statistically significant SIRs greater than 1.0 than statistically significant SIRs less than 1.0.
Table A.3: Number of Hospitals with Statistically Significant SSI SIRs | Pennsylvania 2016-2017 and 2017
5.0.4 Hospital List
Table A.4 displays the comprehensive list of all hospital-surgical procedure pairs in which 1 or more of the surgeries were performed (N=799). The SIR was calculated for 393 hospitals surgery pairs (49%) when the predicted number of infections was greater than 1.0 in 2017. An additional 157 SIRs (20%) could be calculated when 2016 and 2017 data were combined.
The remaining 249 hospital surgery pairs (31%) had less than one predicted infection; therefore, SIRs could not be calculated. In 72 (29%) of those pairs, one or more SSIs occurred even though less than 1.0 was predicted. SIRs were calculated among these 72 hospital-procedure pairs.
Table A.4: Hospitals that Perform Seven Types of Surgeries and their SSI SIRs and Associated Measures | Pennsylvania, 2016-2017 and 2017
Hospitals printed in red have statistically significantly more SSIs than predicted. Hospitals printed in blue have statistically significantly fewer SSIs than predicted.