Chapter 4 Results
Data in this report come from hospitals including large ACHs, CAHs that have less than 25 beds, LTAC facilities where patients typically stay greater than 10 days and require hospital-level care, and specialty hospitals such as women’s, children’s, and psychiatric. This report also includes data from IRFs that consist of both free-standing buildings (N=22) and CMS designated locations within large acute care hospitals (N=59).
NHSN required that all hospitals and IRFs complete an annual survey to report on general information regarding the previous year. In Pennsylvania, 318 facilities completed a 2018 survey in NHSN. One of the 317 facilities was not open for the entire year and was, therefore, excluded from this report.
Table 1 shows the number of hospitals used in the analysis for each type of hospital, HAI and corresponding SUR, CDI and MRSA LabID event metric. Most hospitals that completed the annual NHSN survey reported device days and LabID events. Most of the ACHs that didn’t report device days were inpatient behavioral treatment centers with mental health and addiction programs. LabID events were not routinely reported among children’s hospitals, CAHs, and psychiatric hospitals because guidance from Department of Health states that those facilities are not required to report LabID events.
Table 1: Number of Hospitals that Reported Data for Each of the Metrics | Pennsylvania, 2017
| Hospital Type | Hospital Surveys | CAUTI SIR | Urinary Catheter Days | CLABSI SIR | Central Line Days | MRSA Bloodstream Infection SIR | CDI SIR |
|---|---|---|---|---|---|---|---|
| Acute | 166 | 164 | 166 | 157 | 163 | 165 | 165 |
| Inpatient Rehabilitation | 81 | 81 | 81 | 80 | 81 | 81 | 81 |
| Long Term Acute | 22 | 22 | 22 | 22 | 22 | 22 | 22 |
| Critical Access | 15 | 15 | 15 | 14 | 15 | 11 | 11 |
| Psychiatric | 27 | 8 | 14 | 0 | 6 | 2 | 3 |
| Children’s | 6 | 5 | 6 | 6 | 6 | 2 | 3 |
| SUM | 317 | 295 | 304 | 279 | 293 | 283 | 285 |
4.1 CAUTIs
4.1.1 SIR
In 2017, 1,450 CAUTIs were reported from 295 hospitals. This is 176 fewer CAUTIs than predicted using the 2015 national baseline data (N = 1,626, SIR: 0.89; 95% CI: 0.85-0.94) and 208 fewer than 2016. This is statistically significantly better than the 2015 national baseline.
Nine of the 10 hospitals with the greatest number of urinary catheter days reported have SIRs that are not statistically significantly different from the 2015 national baseline. Together these 9 hospitals contributed 480 CAUTIs. This is almost identical to the predicted number of CAUTIs (N=483) and is one-third of all CAUTIs in the state. Cumulatively, these 9 hospitals had 33 fewer CAUTIs than in 2016, but 3 of the hospitals had more CAUTIs in 2017 than in 2016. One hospital had 25 fewer infections in 2017 than in 2016, which was a 34% reduction.
To reach the 2020 HHS goal of a 25% reduction in CAUTIs from the number that were predicted to occur in 2015, Pennsylvania hospitals need to prevent an additional 231 infections. The 9 hospitals mentioned above need to prevent 118 infections collectively to reach the HHS goal.
Table 2: Summary of CAUTI Measures Stratified by Hospital Type | Pennsylvania, 2017
4.1.1.1 Distribution
As displayed in Table 2, the majority of CAUTIs occurred in ACHs (1,218 of 1,450). Overall, the ACHs performed 15% better than hospitals from the 2015 national baseline (SIR 0.85, 95% CI: 0.80 -0.90). On the other hand, the CAUTI SIR was statistically significantly higher than the 2015 national baseline in IRFs (SIR: 1.37, 95% CI: 1.13-1.66). Twenty-nine more CAUTIs occurred in IRFs than predicted. In LTAC and children’s hospitals, 15 and 4 more CAUTIs, respectively, occurred than were predicted from the 2015 national baseline. CAHs had the same number of predicted and actual CAUTIs, whereas 2 fewer CAUTIs were reported among psychiatric hospitals than predicted.
Figure 1: Distribution of CAUTI SIRs by Hospital Type | Pennsylvania 2016-2017 and 2017

4.1.1.2 Hospital List
Table 3 lists the 296 hospitals and relevant CAUTI data, as well as the county where the hospital is located and year(s) from which the data were based. Thirty-six hospitals (16.8%) had SIRs of zero, meaning that no CAUTIs occurred and more than one was predicted. The corresponding predicted number of CAUTIs ranged between 1.0 and 6.3.
Seventeen hospitals (identified by blue font) had statistically significantly fewer CAUTIs than were predicted in the 2015 national baseline, meaning that their SIR was less than 1.0. Six of these hospitals reported no infections, although the predicted number of infections ranged between 3.5 and 6.3. Among the remaining 8 hospitals where at least one CAUTI occurred, the range of predicted CAUTIs was 7 to 51.
Eleven hospitals (identified by red font) had statistically significant more CAUTIs than were predicted in the 2015 national baseline, meaning that their SIR was more than 1.0. Nine of these hospitals had less than 5 predicted CAUTIs.
Table 3: List of Hospitals with CAUTI SIRs and Associated Measures | Pennsylvania 2016-2017 and 2017
Hospitals printed in red have statistically significantly more CAUTIs than predicted. Hospitals printed in blue have statistically significantly fewer CAUTIs than predicted.
4.1.2 Urinary Catheter SUR
The urinary catheter SUR for Pennsylvania is 0.86 (95%CI: 0.85-0.86). This is 14% lower than the 2015 national baseline. The urinary catheter SUR was calculated for 304 facilities. Nine hospitals reported no urinary catheter days, 48 hospitals reported between 1 and 200 urinary catheter days, 77 reported between 201 and 1,000 urinary catheter days, 90 reported between 1,001 and 5,000 urinary catheter days, 37 hospitals reported between 5,001 and 10,000 urinary catheter days, and the remaining 43 reported between 10,001 and 58,535 urinary catheter days. All hospitals had more than 1 predicted urinary catheter day and had a SUR calculated from 2017 data.
4.1.2.1 Hospital Type
Table 4 lists the SUR, reported and predicted urinary catheter use days for different types of hospitals. Psychiatric hospitals in Pennsylvania, as a group, use urinary catheters 1.72 times more often than similar hospitals from the 2015 national baseline (95% CI: 1.7-1.8). SURs for ACH hospitals (SUR: 0.86 95% CI: 0.86-0.86), LTAC hospitals (SUR: 0.73 95% CI: 0.72-0.73), IRFs (SUR: 0.85 95% CI: 0.84-0.85), and children’s hospitals (SUR: 0.74 95% CI: 0.73-0.75) use urinary catheters less frequently in Pennsylvania than those from the 2015 national baseline. CAHs (SUR: 0.99, 95% CI:0.97-1.0) use urinary catheters similarly as often as CAH hospitals from throughout the United States in 2015.
Table 4: Urinary Catheters SURs by Hospital Type | Pennsylvania, 2016
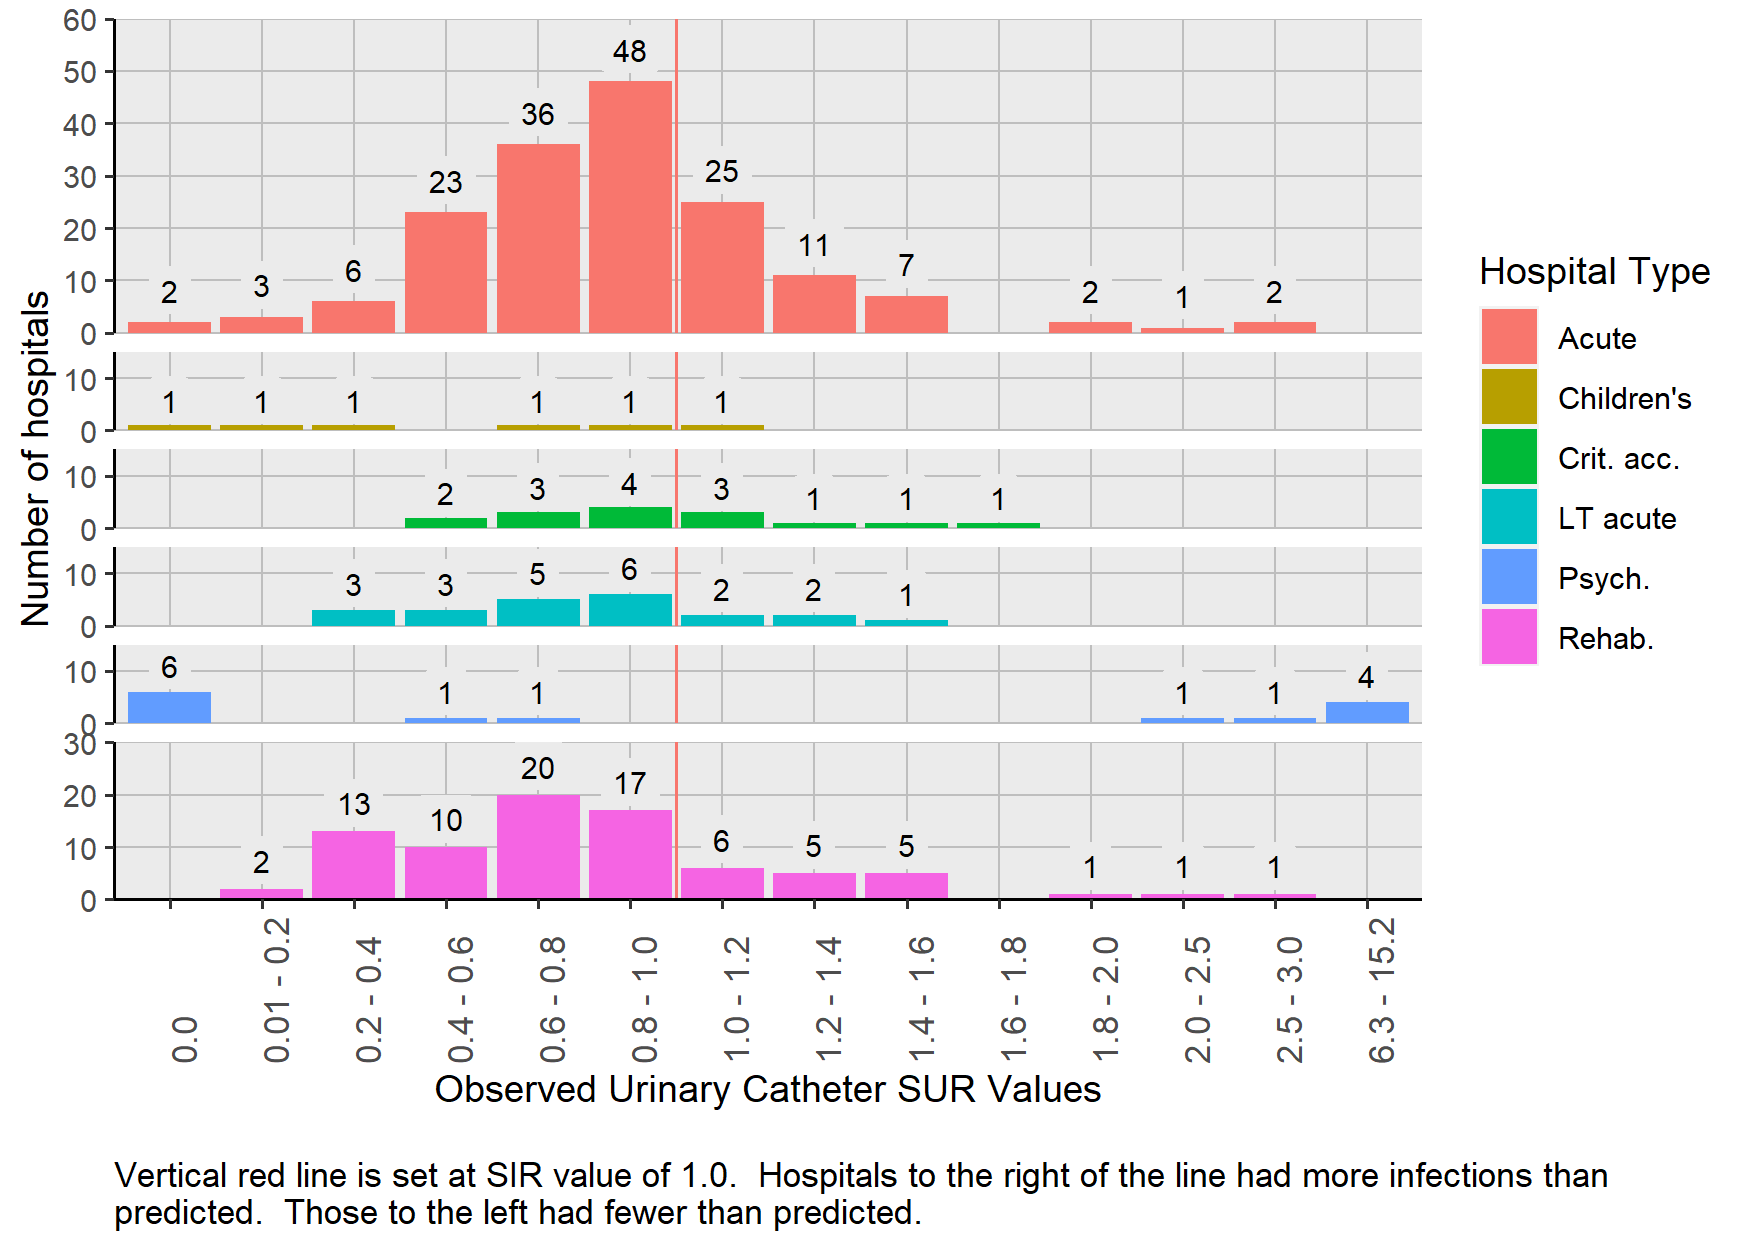
4.1.2.2 Distribution
Figure 2 shows that the hospital-specific urinary catheter SUR values were dispersed and ranged from 0 to 15.2. Eighty-five (28%) of the 304 hospitals had SURs less than 1.0. Four psychiatric hospitals had SURs more than 6.0 (SUR: 15.2, 11.2, 6.8 and 6.3), meaning that urinary catheters were used 6 times greater than those of similar hospitals from the 2015 national baseline. The distribution of SURs in psychiatric hospitals is unique because 42% percent (N=6) had no urinary catheter use, while 42% percent (N=6) used urinary catheters 2 or more times compared to the 2015 national baseline.
Figure 2: Distribution of Urinary Catheter SURs by Hospital Type | Pennsylvania 2017
4.1.2.3 Hospital List
Table 5 shows the actual and predicted number of urinary catheter days, SURs and 95% confidence intervals for each hospital.
Table 5: List of Hospitals with Urinary Catheter SURs by Hospital Name | Pennsylvania 2017
Hospitals printed in red have statistically significantly more urinary catheter days than predicted. Hospitals printed in blue have statistically significantly fewer urinary catheter days than predicted.
4.2 CLABSI
4.2.1 SIR
Psychiatric hospitals reported no central line days and are excluded from this analysis. In 2017, 1,155 CLABSIs were reported from 279 hospitals. The number of reported CLABSIs in 2017 is 274 fewer CLABSIs than predicted using the 2015 national baseline data (N = 1,429.8, SIR: 0.81; 95% CI: 0.76-0.86) and 284 fewer than 2016. Statistically, this was significantly lower than the 2015 national baseline.
Six of the 10 hospitals with the greatest number of central line days have SIRs that are not statistically significantly different from 1.0. This means that they have as many CLABSIs (N=426) as predicted by similar hospitals from the 2015 national baseline (N=423). Together these 6 hospitals contributed 36.6% of all the CLABSIs in the commonwealth. Cumulatively these 6 hospitals have 91 fewer CLABSIs than in 2016. All but one hospital had fewer CLABSIs in 2017 than in 2016.
To reach the 2020 HHS goal of a 50% reduction in CLABSIs, an additional 440 infections need to be prevented throughout the commonwealth. Collectively, the 6 hospitals mentioned above need to prevent 213 infections to reach the HHS goal.
4.2.2 Hospital Type
As seen below in Table 6, the majority of CLABSIs occurred in ACHs (899 of 1,155). Overall, the ACHs performed 24% better than hospitals from the 2015 national baseline (SIR 0.76, 95% CI: 0.72-0.82). LTAC hospitals and IRFs had 4 and 2 more CLABSIs occur, respectively, than were predicted from the 2015 national baseline. One CLABSI occurred in CAHs and 1.46 were predicted. Children’s hospitals had almost 4 fewer CLABSIs than predicted by the statistical model.
Table 6: Summary of CLABSI Measures Stratified by Hospital Type | Pennsylvania, 2017
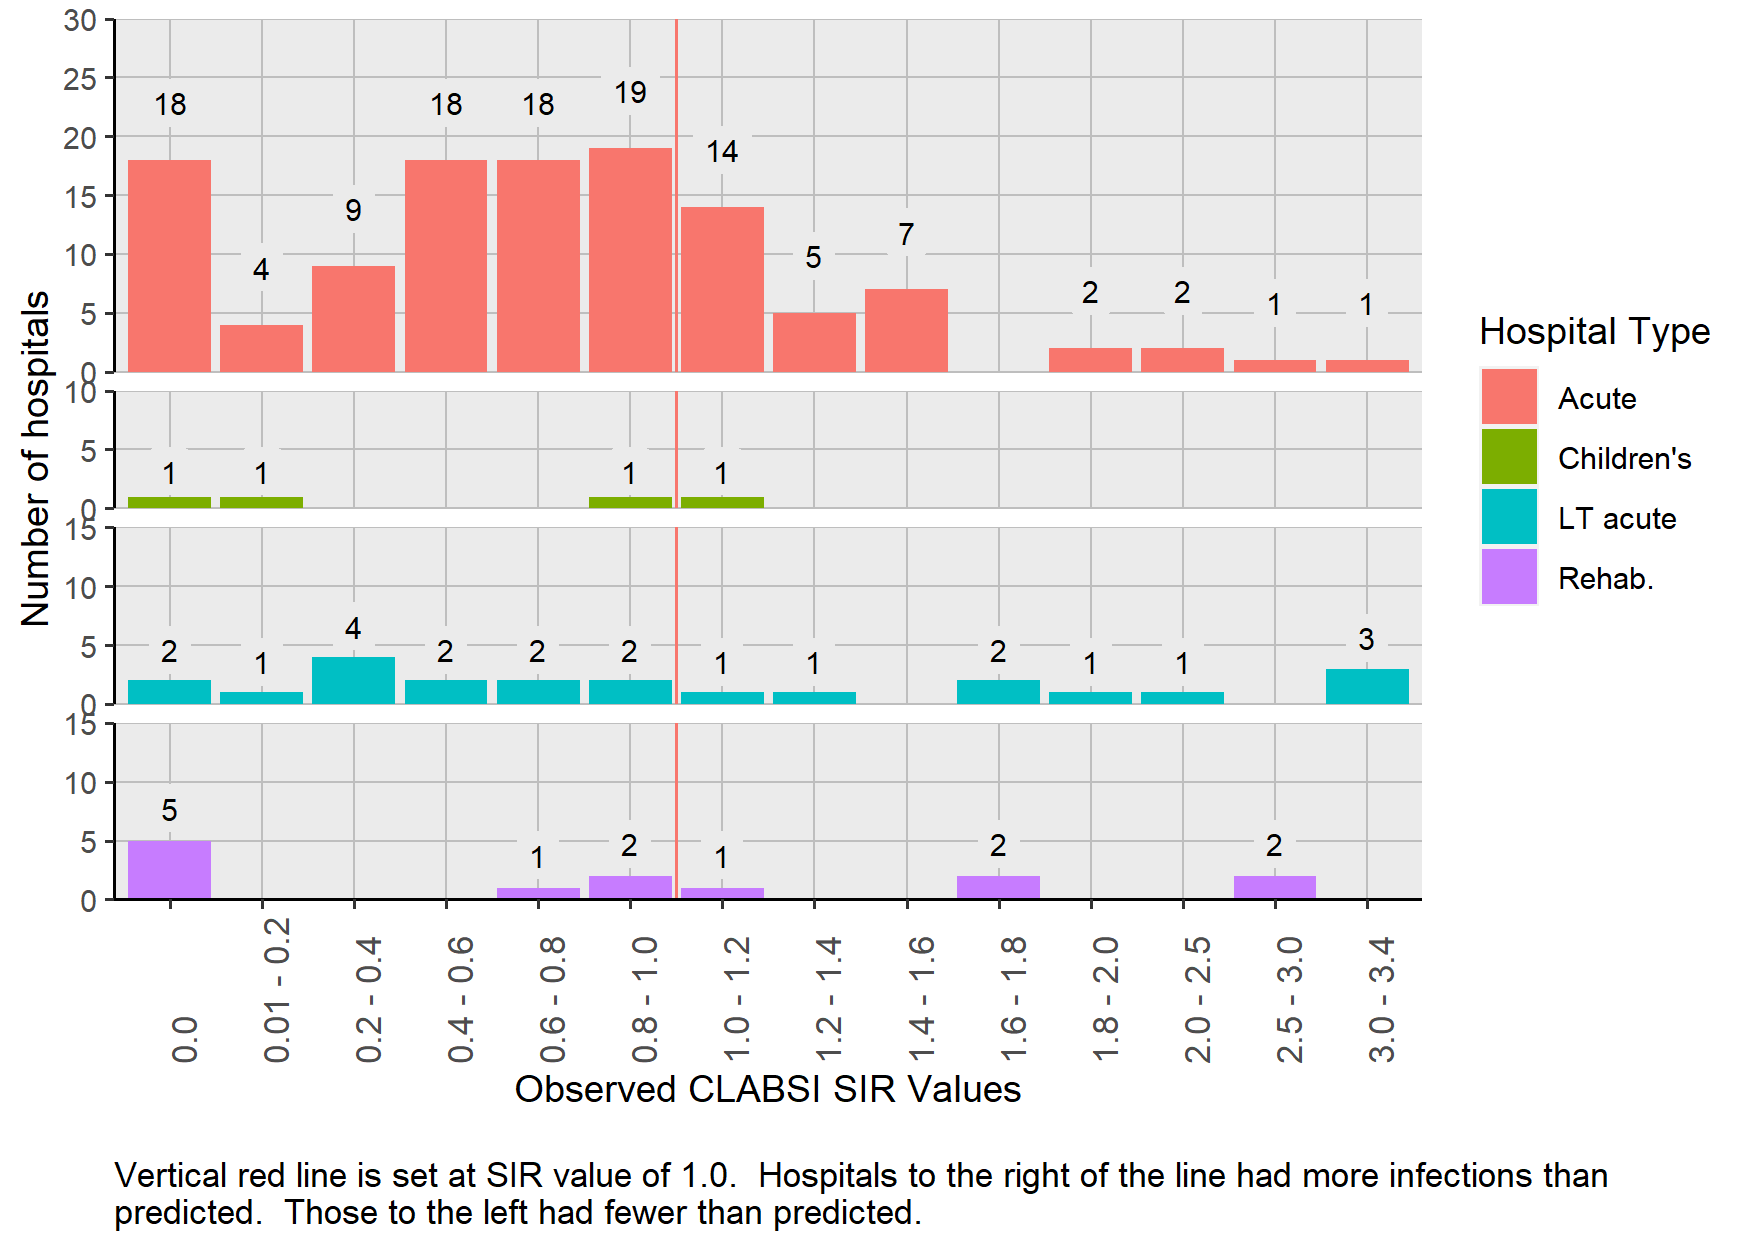
4.2.2.1 Distribution
Figure 3 displays the distribution of hospital specific SIRs (N=157) grouped by hospital type. This includes 136 hospitals in which a SIR was calculated with 2017 data and 21 hospitals with 2016 and 2017 data combined. Despite the inclusion of 2 years of surveillance data, 122 (78 percent) hospitals had less than one predicted infection and relatively few central lines days (maximum = 3,134) compared to hospitals in which at least one infection was predicted. Thirty-five CLABSIs occurred in 25 (20%) of those hospitals, and SIRs were not calculated because the number of predicted infections was less than 1. Hospital specific SIRs were not calculated for CAHs because the number of predicted CLABSIs were less than 1.0.
Figure 3: Distribution of CLABSI SIRs by Hospital Type | Pennsylvania 2016-2017 and 2017
4.2.2.2 Hospital List
Table 7 lists CLABSI data, as well as county location of hospital and year(s) from which the data were based from 273 hospitals.
Twenty-six hospitals had SIRs of zero even though the number of predicted CLABSIs ranged between 1 and 7.2. Twenty-four hospitals (identified by blue font) had statistically significant SIRs that were less than 1.0, meaning that they had fewer CLABSIs than in the 2015 national baseline. Seven of these hospitals had no infections, although the predicted number of infections ranged between 3.1 and 7.2. Among the remaining 17 hospitals, where at least one CAUTI occurred, the range of predicted CAUTIs was 5.3 to 55.
Only 4 hospitals (identified by red font) had statistically significant SIRs that were more than 1.0, meaning that they had more CLABSIs compared to the 2015 national baseline. Together these hospitals contributed 51 CLABSIs.
Table 7: List of Hospitals with CLABSI SIRs and Associated Measures | Pennsylvania 2016-2017 and 2017
Hospitals printed in red have statistically significantly more CLABSIs than predicted. Hospitals printed in blue have statistically significantly fewer CLABSIs than predicted.
4.2.3 Central Line SUR
Central lines days were reported from 293 hospitals. Central lines were not used in psychiatric and rarely used in critical access hospitals because patients in those facilities typically do not present with medical conditions that require monitoring with a central line or these patients are transferred to an acute care hospital after placement of a central line.
Fourteen hospitals reported no central line days, 61 reported between 1 and 200 central line days, 63 reported between 201 and 1,000 central line days, 91 reported between 1,001 and 5,000 central line days, 33 reported between 5,001 and 10,000 central line days, and 31 reported between 10,001 and 86,575 central line days. The central line SUR was calculated for all the facilities that reported data. The state SUR was 0.85 (95% CI: 0.85-0.85) which is 15% less use than predicted by the 2015 national baseline.
4.2.3.1 Hospital Type
Table 8 lists actual and predicted central line days and SURs stratified by hospital type. Central line catheters were most frequently used in ACHs (1,169,177 central line days). ACHs, IRFs, and LTACs use central line catheters less frequently than predicted by the 2015 national baseline. Children’s hospitals and CAHs use central line catheters more often than predicted than the 2015 national baseline.
Table 8 lists summary statistics regarding central line use in different types of hospitals.
Table 8: Central line SURs by Hospital Type | Pennsylvania, 2016
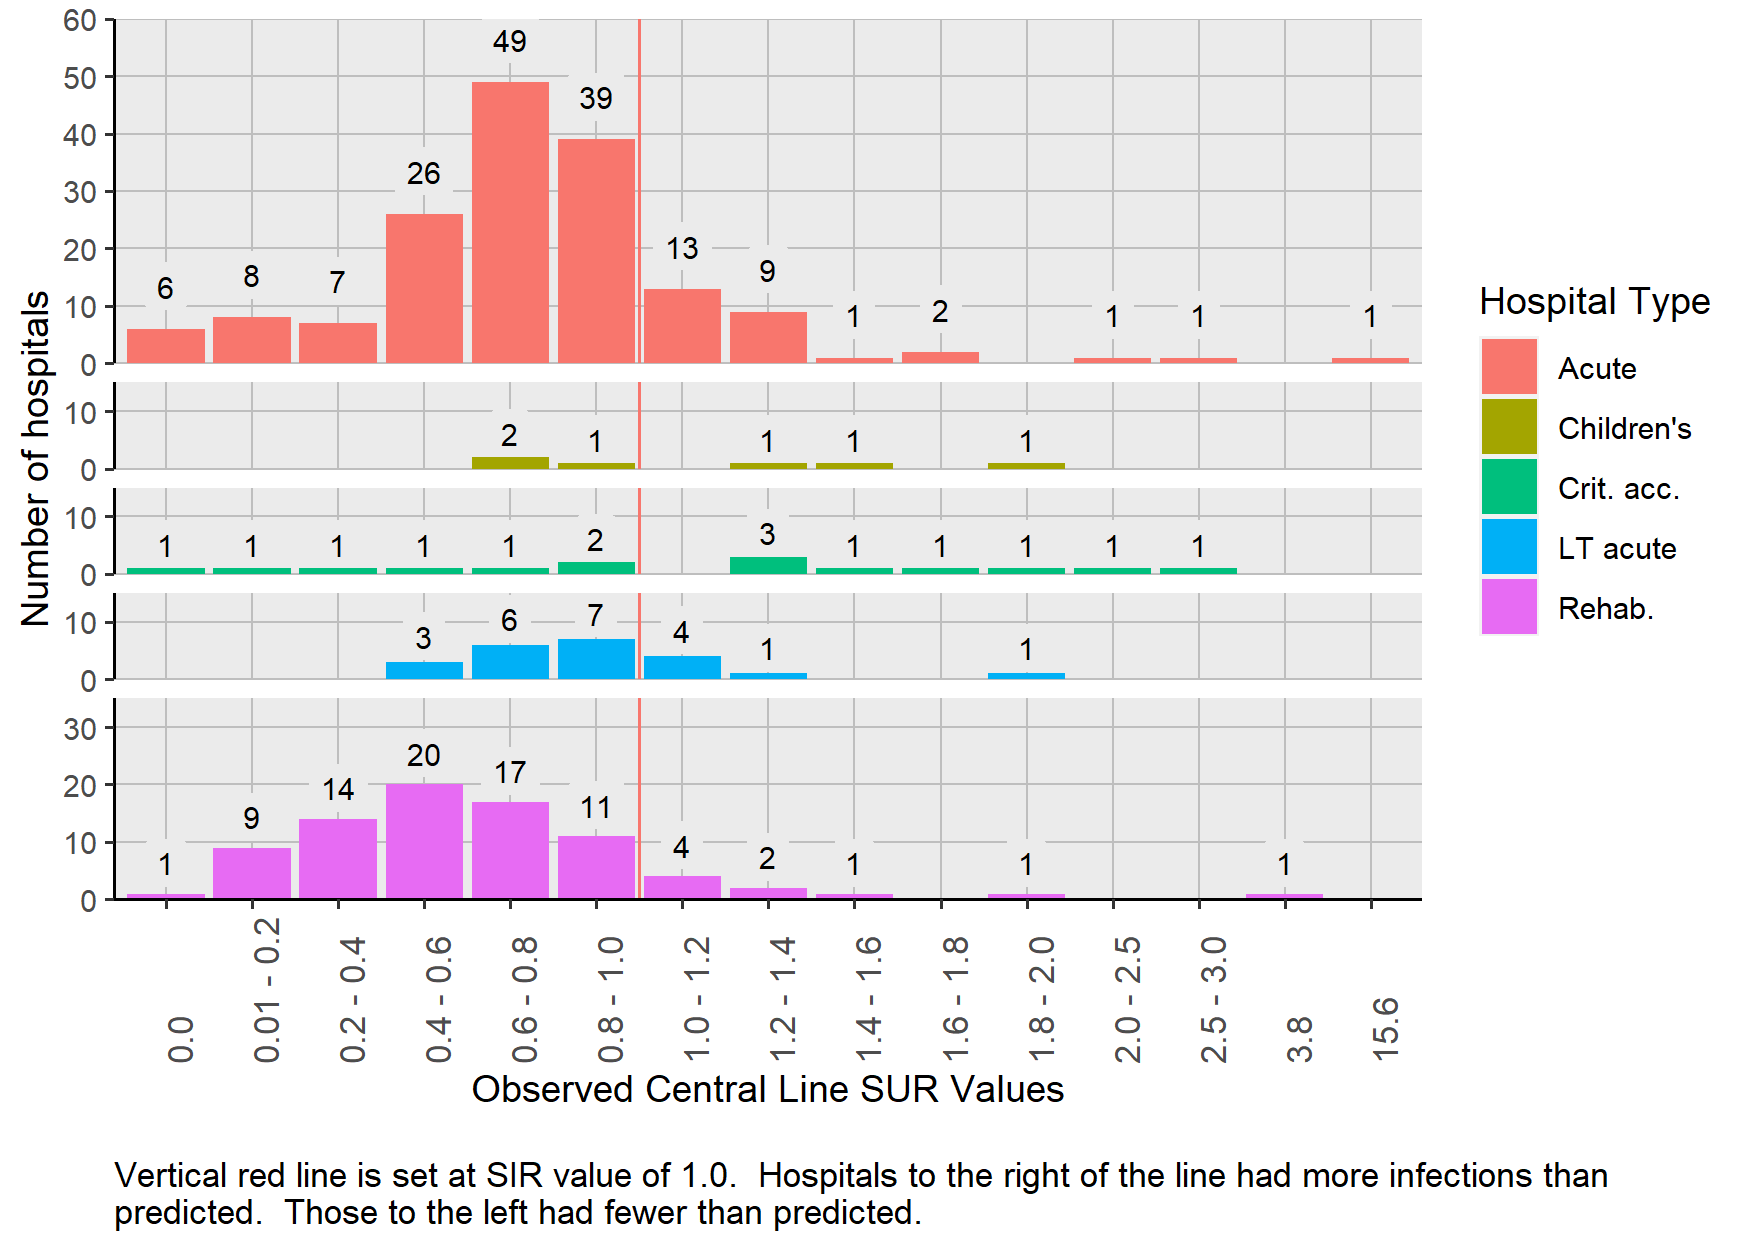
4.2.3.2 Distribution
Figure 4 shows that the hospital-specific central line SUR values were dispersed and ranged from zero to 15.6. Two hundred thirty-three (80%) of the 293 hospitals had SURs less than 1.0. Six hospitals had SURs more than 2 and 2 had SURs greater than 3.0. Collectively, these 6 hospitals reported 11 CLABSIs.
Figure 4: Distribution of Central Line SURs by Hospital Type | Pennsylvania 2017
4.2.3.3 Hospital List
Table 9 shows that the number of predicted central line days in hospitals ranged from 3.6 to 69,328, and the observed use ranged from zero to 86,575. Examination of the hospitals with the highest 10 SURs shows that all but 1 had fewer than 2,000 predicted central line days.
Table 9: List of Hospitals with Central Line SURs by Hospital Name | Pennsylvania 2016-2017 and 2017
Hospitals printed in red have statistically significantly more central line days than predicted. Hospitals printed in blue have statistically significantly fewer central line days than predicted.
4.3 SSIs
4.3.1 Description of Surgical Procedures
This 2017 report includes HAIs that occurred following 7 surgical procedure types: 3 types of cardiac surgery, hip and knee replacements, abdominal hysterectomy, and colon surgery. After applying the exclusion criteria, a total of 119,219 surgical procedures were performed and followed for signs of a surgical site infection (SSI) in 172 hospitals during 2017. As a reminder, patients who had surgical procedures but did not spend the night in the hospital were excluded because this type of procedure was classified as an outpatient procedure, not an inpatient procedure.
Table 10 shows that 52 hospitals perform all 7 surgeries while 7 hospitals only performed knee and hip replacement surgeries. Table 11 shows the number of surgeries included in this report that were performed at each hospital for each surgical procedure type in 2017.
Table 10: SSI SIRs for each of 7 procedures | Pennsylvania, 2017
| Number of Hospitals | Abdominal Hysterectomy | Cardiac Surgery | CBG Surgery 1 incision | CBG Surgery 2 incisions | Colon | Hip Replacement | Knee Replacement |
|---|---|---|---|---|---|---|---|
| 67 | X | X | X | X | |||
| 52 | X | X | X | X | X | X | X |
| 11 | X | X | X | ||||
| 7 | X | X | |||||
| 6 | X | X | X | ||||
| 6 | X | X | X | X | X | X | |
| 5 | X | ||||||
| 5 | X | X | X | X | X | ||
| 3 | X | X | |||||
| 2 | X | ||||||
| 2 | X | X | X | X | |||
| 1 | X | ||||||
| 1 | X | X | |||||
| 1 | X | X | X | X | X | X | |
| 1 | X | X | |||||
| 1 | X | X | X | ||||
| 1 | X | X | X | X | X | X |
Table 11: Number of surgeries performed at each hospital | Pennsylvania, 2017
4.3.2 SIRs
As mentioned in the Methods chapter of this report, the NHSN protocol sets forth 2 different methods to evaluate SSIs, which are referred to as “all” and “complex”. Results presented in this section contain metrics using the “complex” model definition, which includes only deep tissue and organ space SSIs. (SSI results that use the “all” case definition are presented in Appendix A.) Superficial infections are not counted as cases in the “complex” model. For a more detailed description of the complex case definition and adjustment models, please refer to the SIR Guide Supplement.39
4.3.3 State SSI SIRs
Table 12 shows the number of surgeries performed in 2017, number of SSIs, number of predicted infections and respective SIRs for each surgical procedure. Knee replacement surgeries are the most commonly performed surgeries reported in NHSN with almost 45,000 performed during 2017. CBG with 2 incisions and CBG with 1 incision were only performed in acute care hospitals.
SSI SIRs for all 7 monitored surgical procedures range between 0.78 and 0.94. The state-wide SSI SIR for colon surgeries is statistically significantly lower than the 2015 national baseline (SIR: 0.81, 95% CI: 0.73-0.90). SIRs for the other 6 surgical procedures are less than 1.0 but are not statistically different than the 2015 national baseline. To reach the 2020 HHS goal of a 30% reduction (SIR = 0.70) in colon SSIs, an additional 47 colon SSIs need to be prevented. To reach the same goal in abdominal hysterectomy SSIs, an additional 18 infections need to be prevented.
Table 12: SSI SIRs for each of 7 procedures | Pennsylvania, 2017
4.3.4 Hospital Type
Because nearly all surgical procedures were performed in acute care hospitals, calculation of 2017 SSI SIRs stratified by hospital type is very limited. Only 4 surgical type and hospital type pairs had more than one predicted SSI. These are presented in Table 13 below.
All surgeries that were performed in these settings had lower SIRs than the 2015 national baseline, although none reached statistical significance.
Table 13: SIRs from Surgical-Procedure Combinations Commonly Performed in Specific Hospital Types | Pennsylvania, 2017
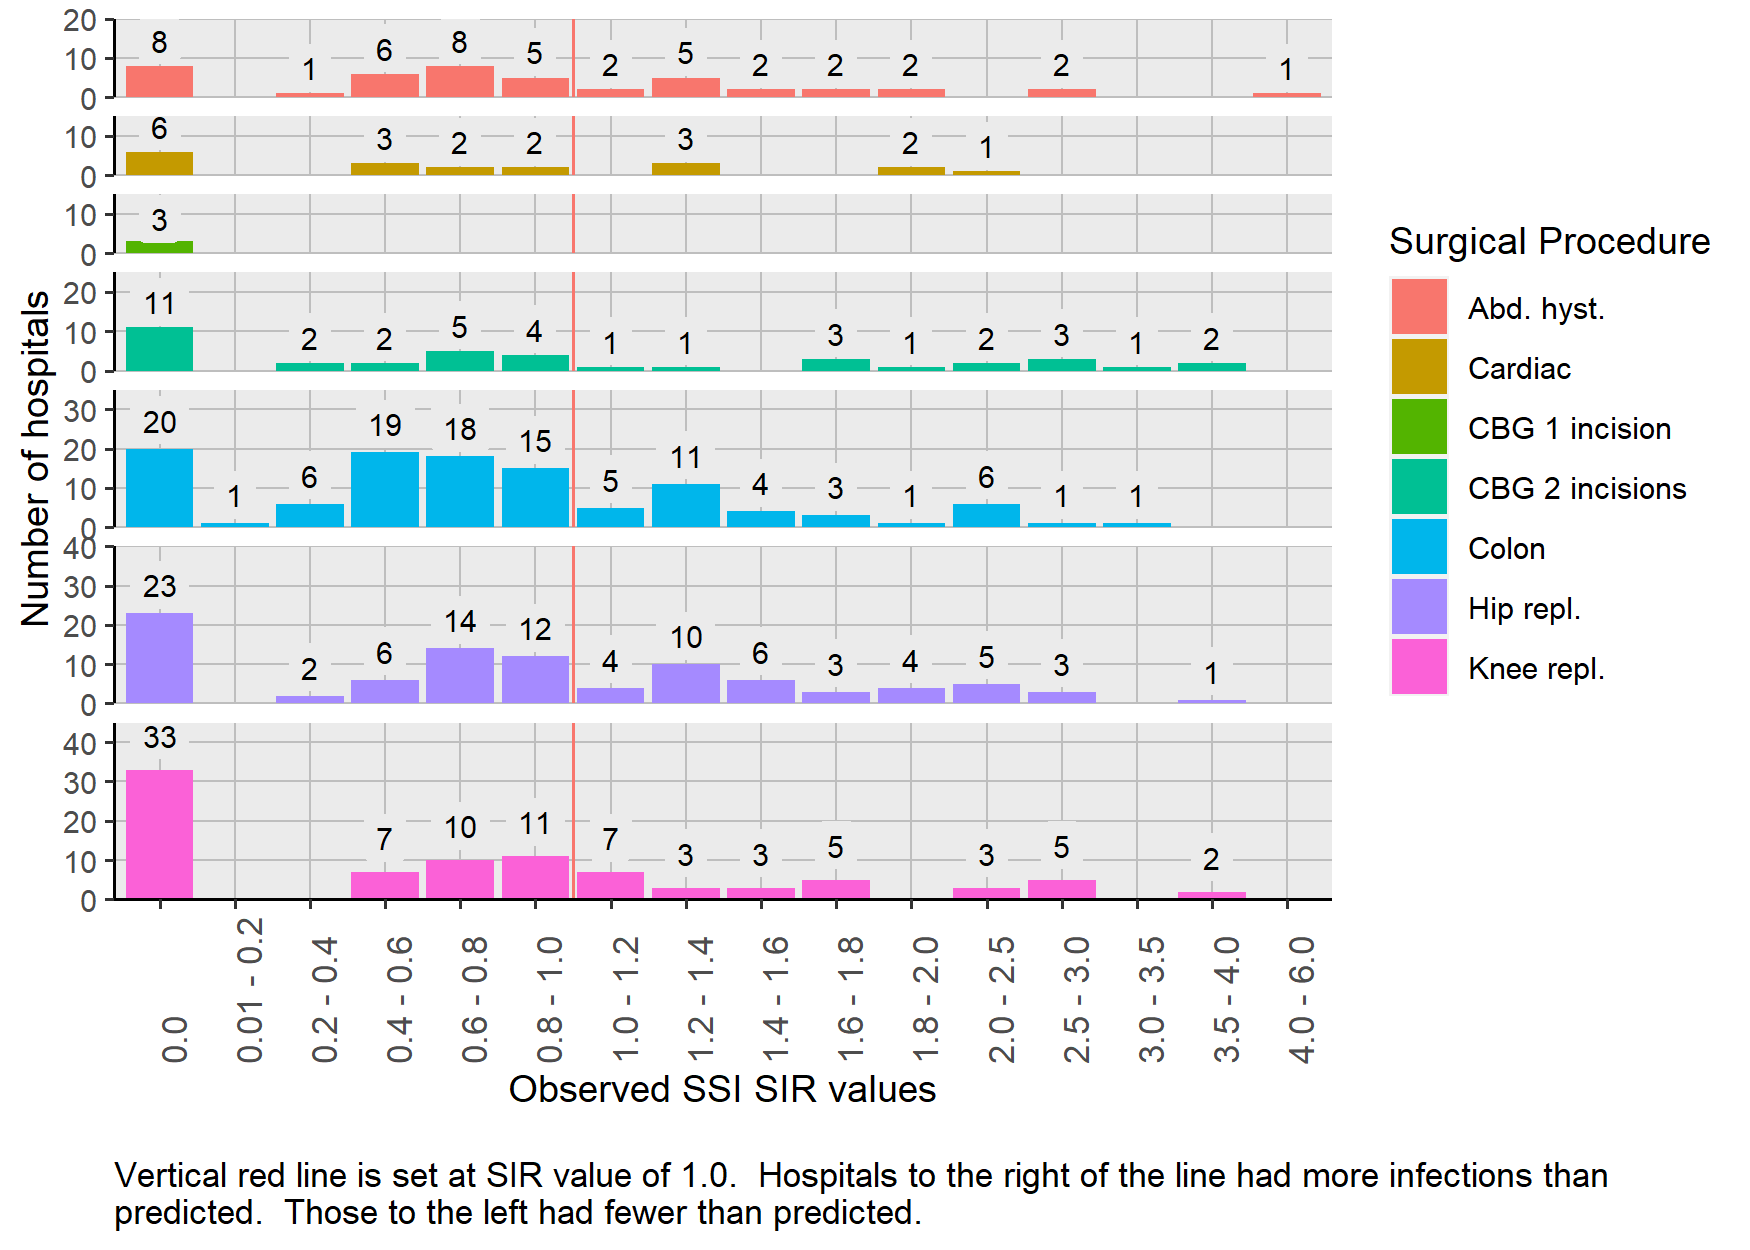
4.3.5 Distribution
The distribution of 2017 and 2016 - 2017 SIRs for the 7 surgery types is presented in Figure 5. Because the SIR was calculated in those hospitals in which the predicted number of infections was 1.0 or more for either timeframe, 397 hospital-procedure pairs are included. This includes only 4 hospital surgery pairs from children’s hospitals. The remaining SIRs are from acute care hospitals. Thirty-nine (10%) of the SIRs were 2 or larger.
The shape of the distribution curve of 2017 or 2016-2017 SIRs for colon surgery, hip and knee replacement, and hysterectomy SSIs looks similar. These 4 surgical procedures have a substantial number of SIRs equal to zero, with the most hospitals classified within the SIR category of 0.6 - 0.8.
The shape of the distribution curves of cardiac procedures have a different shape than the other 4 because there are many fewer hospitals for which a SIR was calculated. Each of the 3 hospitals that performed CBG with 1 incision and had more than 1 predicted infection had zero infections. However, as seen in Table 12, 7 infections occurred among the remaining 49 facilities in which the number of predicted infections was less than 1.0.
Figure 5: Distribution of SIRs Stratified by Surgical Procedure Type| Pennsylvania, 2016-2017 and 2017
4.3.6 Statistically Significant SSI SIRs
Table 14 shows the number of hospitals with statistically significant SSIs. Nearly 2 times as many hospitals have statistically significantly higher SIRs than those with SIRs statistically significantly lower SIRs. Of the 6 surgical procedures, colon procedures had the most facilities (n=6) with SIRs that were statistically significantly less than the 2015 national baseline. No hospitals had significantly fewer SSIs than the 2015 national baseline for abdominal hysterectomies, CBG with 2 incisions, hip replacement, and knee replacement. Several facilities had SIRs that were statistically significantly more than the 2015 national baseline for these procedures.
Because only 3 hospitals had a SIR calculated for the CBG surgery with 1 incision and the number of predicted infections was so low, none of those SIRs reached statistical significance.
Table 14: Number of hospitals with statistically significant SSI SIRs | Pennsylvania, 2016-2017 and 2017
4.3.7 Hospital List
Table 15 displays the comprehensive list of all hospital-surgical procedure pairs in which one or more of the surgeries was performed during 2017 (N=799). The SIR was calculated for 258 hospitals surgery pairs (32% of 799) when the predicted number of infections was more than 1.0 in 2017. An additional 139 SIRs (18%) could be calculated when 2016 and 2017 data were combined. The remaining 402 hospital surgery pairs (50%) had less than 1.0 predicted infections and SIRs could not be calculated. One hundred-twelve (28%) of those pairs had 1 or more SSIs occur even though less than 1.0 was predicted.
Table 15: Hospitals that Perform Seven Types of Surgeries and their SSI SIRs and Associated Measures | Pennsylvania, 2016-2017 and 2017
Hospitals printed in red have statistically significantly more SSIs than predicted. Hospitals printed in blue have statistically significantly fewer SSIs than predicted.
4.4 C. difficile Infections
CDI LabID events are the most common type of reported events in this report. In 2017, 4,636 CDI events occurred, and 5,383 were predicted from the 2015 national baseline. This reflects the fact that all people admitted to a hospital are at risk to get a CDI and each day in the hospital increases the chance of getting a CDI24.
The CDI SIR was 0.86 (95%CI: 0.84-0.89), which means that the number of CDI cases was 14% lower compared to the 2015 national baseline.
Eight of the 10 hospitals with the most patient days had SIRs that were (statistically significantly) more than or not different from the number of predicted CDIs using the 2015 national baseline. These 8 hospitals contributed 1,196 CDIs. To reach the 2020 HHS goal of a 30% reduction (SIR = 0.70) in CDI events, an additional 868 CDIs need to be prevented. The above 8 hospitals collectively need to prevent 446 CDI LabID events to reach the HHS goal.
4.4.1 Hospital Type
As shown in Table 16, most (88%) CDI events occurred in acute care hospitals and the SIR was 0.85 (95%CI: 0.82-0.87). This means that CDI events in 2017 were 15% lower in acute care hospitals than in the 2015 national baseline. Departmental guidance states that children’s, CAH and psychiatric hospitals are not required to report LabID events. The data reported here do not reflect CDI events from those facilities. About the same number of CDI events were reported in IRFs as LTAC hospitals, even though the number of patient days was nearly 3 times higher in IRFs. This was because the rate of CDI was higher in LTAC hospitals than the rate in IRFs. LTAC hospitals care for patients who are expected to be hospitalized for more than 30 consecutive days. The SIR in IRFs was 0.87 (95% CI: 0.77–0.98). IRFs had 38 fewer CDI events than predicted by the 2015 national baseline. The SIR in LTACs was 1.18 (95% CI: 1.04-1.35). LTAC hospitals reported 36 more CDI events than were predicted.
Table 16: C. difficile Infection Event SIRs by Hospital Type | Pennsylvania, 2017
4.4.2 Distribution
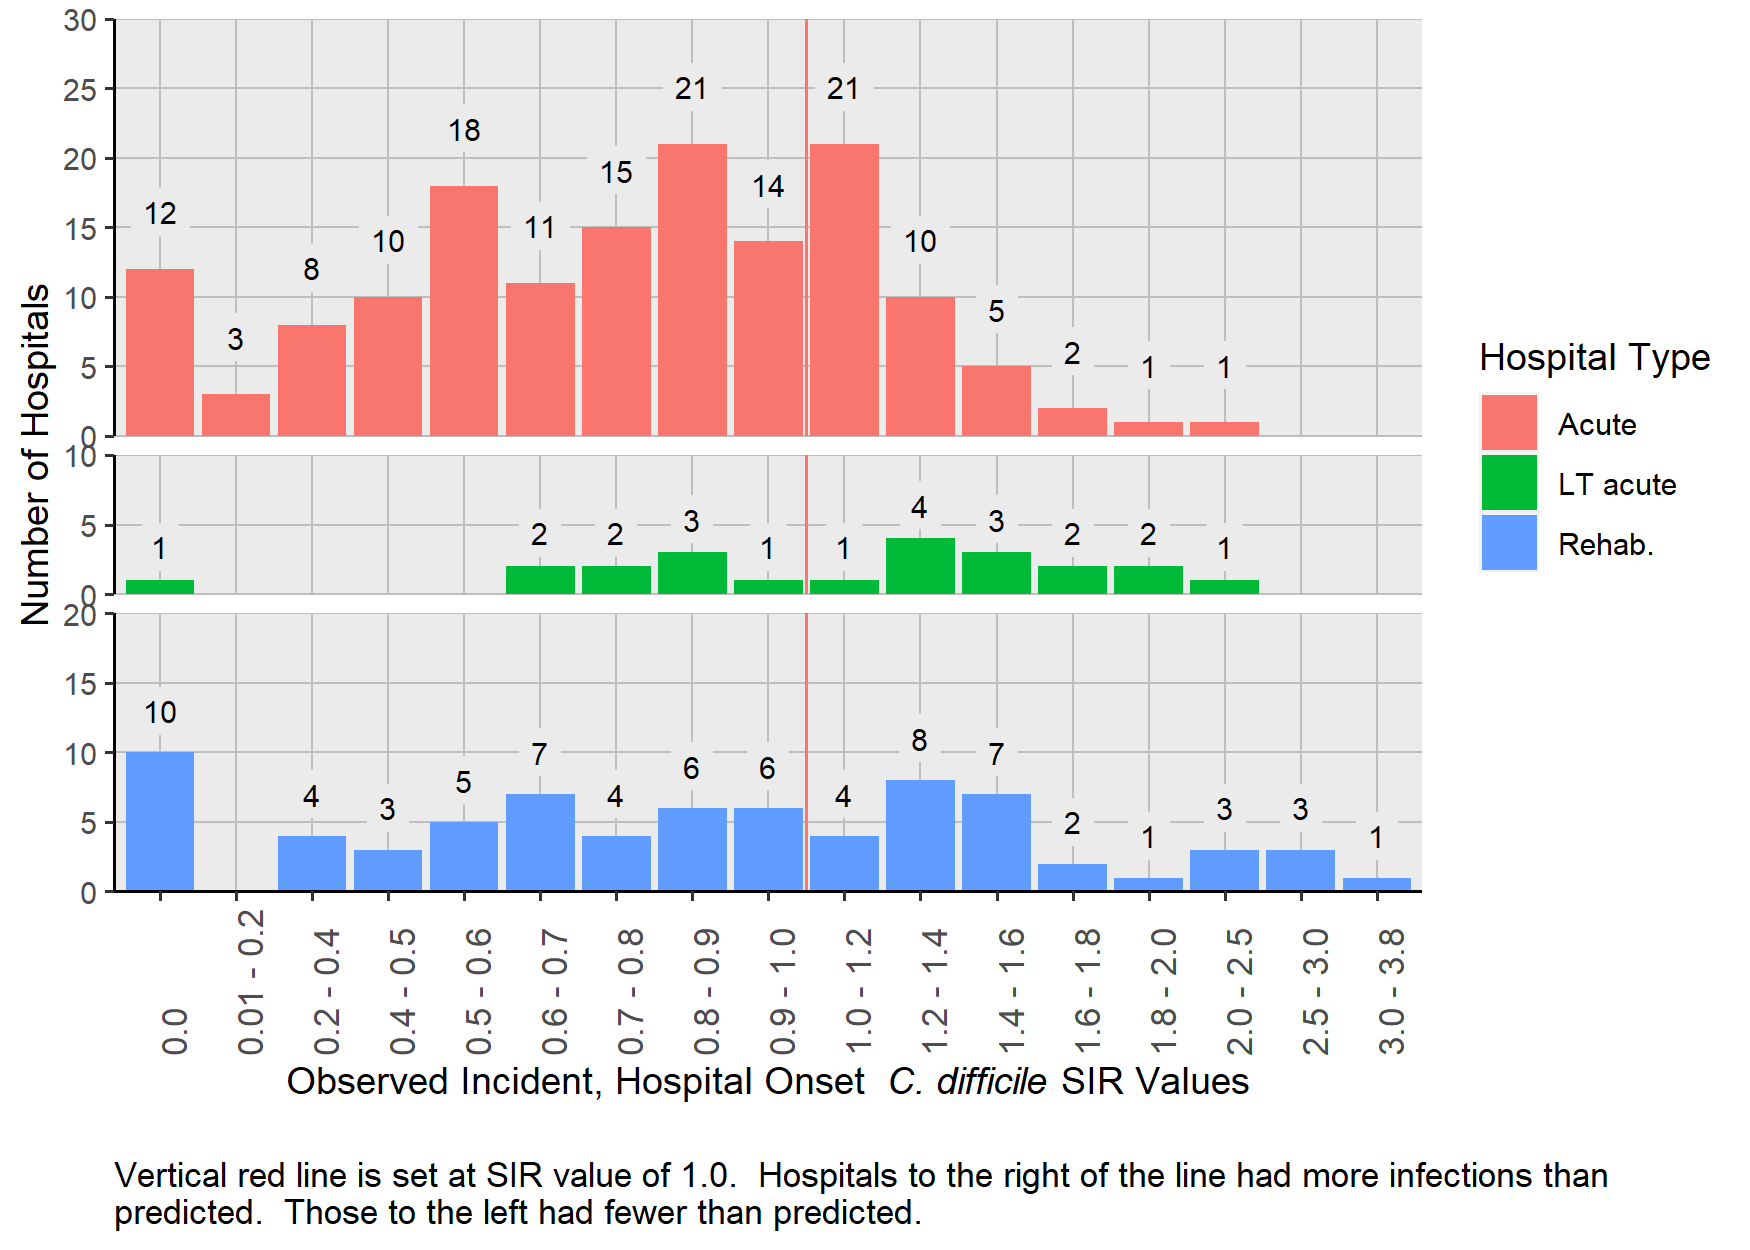
Figure 6 shows the distribution of CDI SIRs for ACH, LTAC hospitals, and IRFs among hospitals with a SIR. Because so few CDI event data were reported from individual children’s hospitals, CAHs, and psychiatric hospitals, their data are not shown. This figure includes 228 hospitals in which a SIR was calculated using 2017 data and 19 hospitals with 2016 and 2017 data combined. Only 19 (9.8%) of hospitals had less than 1.0 predicted infection. Only 2 CDI events occurred in those hospitals.
The SIRs among the 247 hospitals ranged from zero to 3.8. The distribution among the 150 ACH shows that most SIRs (73%) were less than 1.0. The low number of LTAC hospitals with SIRs less than 0.6 demonstrates challenges in preventing CDI events. Only one LTAC hospital was able to achieve zero CDI events. Sixty percent (N=45) of IRFs had a SIR less than 1.0, and 7 IRFs had SIRs more than 2.0.
Figure 6: Distribution of C. difficile SIRs Stratified by Hospital Type| Pennsylvania, 2016-2017 and 2017
4.4.3 Hospital List
Table 17 shows the patients at risk for CDI, number of CDI events and SIR for each Pennsylvania hospital that reported data (N=285). This also displays the type of CDI test that the hospital used for the full 2017 calendar year. The statistical models adjust for type of CDI test that was performed for each quarter of the year. The CDI test is not a factor that can explain differences between SIRs. The display of CDI test type used by hospitals is included in this table as a courtesy for facilities to evaluate CDI test methods used by their peers.
Twenty-eight hospitals had SIRs of zero, even though the number of predicted CDI events ranged between 1 and 9.9. Forty-three hospitals (identified by blue font) had statistically significant SIRs that were less than 1.0, meaning that they had fewer CDI events than predicted by the 2015 national baseline. Five of these hospitals had no CDI events, although the predicted number ranged between 4.3 and 9.9. Among the remaining 38 hospitals where at least 1 CDI event occurred, the range of predicted CDIs was 5.3 to 154. Thirteen hospitals had statistically significant elevated SIRs, meaning that more CDI events occurred than predicted during the 2015 national baseline. The SIRs ranged from 1.16 to 3.81.
Table 17: List of Hospitals with C. difficile Infection Event SIRs by Hospital Name | Pennsylvania 2016-2017 and 2017
Hospitals printed in red have statistically significantly more CDI events than predicted. Hospitals printed in blue have statistically significantly fewer CDI events than predicted.
4.5 MRSA Blood Infections
In 2017, 408 MRSA bloodstream events occurred and 498 were predicted from the 2015 national baseline. This results in a SIR of 0.82 (95% CI: 0.74-0.90). Departmental guidance states that children’s, CAHs, and psychiatric hospitals are not required to report MRSA blood LabID events. The data reported here do not fully reflect MRSA bloodstream events from those facilities.
Nine of the 10 facilities with the most patient days had SIRs that were not statistically significantly lower than 1.0. These 9 hospitals reported 117 MRSA LabID events.
To reach the 2020 HHS goal of a 50% reduction (SIR = 0.50) in MRSA LabID events, an additional 158 infections need to be prevented. The 9 facilities mentioned above need to prevent 45 MRSA LabID events to meet the 2020 HHS goal.
4.5.1 Hospital Type
Table 18 lists patient days at risk, number of predicted and observed MRSA LabID events, and the SIRs for only ACH, Children’s, LTAC hospitals, and IRFs (n = 270). ACHs had statistically significantly fewer MRSA LabID events predicted (SIR: 0.78, 95% CI: 0.70-0.86), whereas LTAC hospitals had more MRSA LabID events than predicted by the 2015 national baseline (SIR: 1.61, 95% CI: 1.18-2.14). IRFs had less than half of MRSA LabID events than predicted (SIR: 0.47, 95% CI: 0.19-0.98) by the 2015 national baseline. Even though this is not statistically significant, it meets the HHS 2020 reduction goal and is a noteworthy achievement.
Table 18: MRSA Blood Infections SIRs by Hospital Type | Pennsylvania, 2017
4.5.2 Distribution
Figure 7 shows the distribution of MRSA LabID SIRs for ACHs, LTAC hospitals, and IRFs. This figure includes 107 hospitals in which a SIR was calculated with 2017 data and 28 hospitals with 2016 and 2017 data combined. Despite the inclusion of 2 years of surveillance data, 145 (51%) hospitals had less than 1.0 predicted infection. Thirty-one MRSA bloodstream infection events occurred in 24 of those hospitals.
The SIRs among 135 hospitals shown in Figure 7 ranged from zero to 7.8. The distribution of SIRs in ACH and LTAC hospitals has a wide distribution, while the SIRs from IRFs is either zero or 0.6. The distribution among the 110 ACH shows that most SIRs (N=82, 75%) were less than 1.0. The distribution among the 22 LTAC hospitals shows that a little more than half of the SIRs (N=12, 55%) were less than 1.0.
Figure 7: Distribution of MRSA Blood Infection SIRs Stratified by Hospital Type| Pennsylvania, 2016-2017 and 2017

4.5.2.1 Hospital List
Table 19 includes 283 hospitals from all facilities that submitted data. Thirty-eight hospitals had SIRs of zero, and the number of predicted MRSA LabID events ranged between 1 and 4.4. Four hospitals (identified by blue font) had statistically significant SIRs that were less than 1.0, meaning that they had fewer MRSA events than in the 2015 national baseline. Two of these hospitals had no MRSA LabID events. Four hospitals had statistically significant SIRs more than 1.0, meaning that more MRSA LabID events occurred than predicted during the 2015 national baseline.
Table 19: List of Hospitals with MRSA Blood Infection SIRs by Hospital Name | Pennsylvania 2017
Hospitals printed in red have statistically significantly more urinary catheter days than predicted. Hospitals printed in blue have statistically significantly fewer urinary catheter days than predicted.