4 Results
Data in this report come from hospitals including large ACHs, CAHs that have less than 25 beds, LTAC facilities where patients typically stay more than 10 days and require hospital-level care, and specialty hospitals such as children’s hospitals and IPFs. This report also includes data from IRFs that consist of both free-standing buildings (N=19) and CMS designated locations within large acute care hospitals (N=49).
The National Healthcare Safety Network requires that all hospitals and IRFs complete an annual survey to report general information regarding the previous year. In Pennsylvania, 301 facilities completed a survey in NHSN. Three of the 301 facilities were not open for the entire year and were, therefore, excluded from this report.
Table 1 shows the number of facilities used in the analysis for each type of facility, HAI and metric. Most hospitals that completed the annual NHSN survey reported device days and LabID events. Laboratory-identified events were not routinely reported among children’s hospitals, CAHs, and IPFs because Department guidance states that those facilities are not required to report LabID events.
Table 1: Number of Hospitals that Reported Data for Each of the Metrics | Pennsylvania, 2020
| Hospital Type | Hospital Surveys | CAUTI SIR | Urinary Catheter Days | CLABSI SIR | Central Line Days | MRSA Bloodstream Infection SIR | CDI SIR |
|---|---|---|---|---|---|---|---|
| ACH | 160 | 157 | 157 | 157 | 157 | 157 | 157 |
| CAH | 16 | 16 | 16 | 16 | 16 | 0 | 0 |
| Children’s | 5 | 5 | 5 | 5 | 5 | 0 | 0 |
| LTAC | 17 | 17 | 17 | 17 | 17 | 16 | 17 |
| IPF | 32 | 16 | 16 | 12 | 12 | 0 | 0 |
| IRF | 68 | 67 | 67 | 67 | 67 | 68 | 67 |
| Total | 298 | 278 | 278 | 274 | 274 | 241 | 241 |
4.1 CAUTI
4.1.1 CAUTI SIR
In 2020, 1,304 CAUTIs were reported from 278 hospitals. This was 283 fewer CAUTIs than predicted using the 2015 national baseline data (N = 1,587; SIR: 0.82; 95% CI: (0.78, 0.87)) and 131 more CAUTIs than reported in 2019. This SIR was statistically significantly lower than the 2015 national baseline.
Of the 10 hospitals with the greatest number of predicted infections, five had a lower statistically significant SIR than the 2015 national baseline. The SIR values from the five other hospitals were not statistically significantly different from the 2015 national baseline data. Together these five hospitals reported 183 CAUTIs. This is 14% of all CAUTIs in the state and 14% of the number predicted infections in the whole state were predicted to come from these hospitals. It can be interpreted that these hospitals performed the same as hospitals from the 2015 national sample. Cumulatively, these five hospitals had 32 more CAUTIs than in 2019.
4.1.2 CAUTI Measures by Type of Hospital
As displayed in Table 2, the majority of CAUTIs were reported in ACHs (1,128 of 1,304). Overall, the ACHs performed 20% better than hospitals from the 2015 national baseline (SIR: 0.8; 95% CI: (0.75, 0.85)). On the other hand, CAHs reported the same number of CAUTIs as predicted (SIR: 1.04) and IRFs reported 15 more CAUTIs than predicted (SIR: 1.2; 95% CI: (0.97, 1.46)). The CAUTI SIR was smaller than 1.0 in children’s hospitals (SIR: 0.88), in LTAC hospitals (SIR: 0.85), and in IPFs (SIR: 0.43), but it did not reach statistical significance.
Table 2: Summary of CAUTI Measures Stratified by Hospital Type | Pennsylvania, 2020
4.1.3 Distribution of CAUTI SIR Values by Type of Hospital
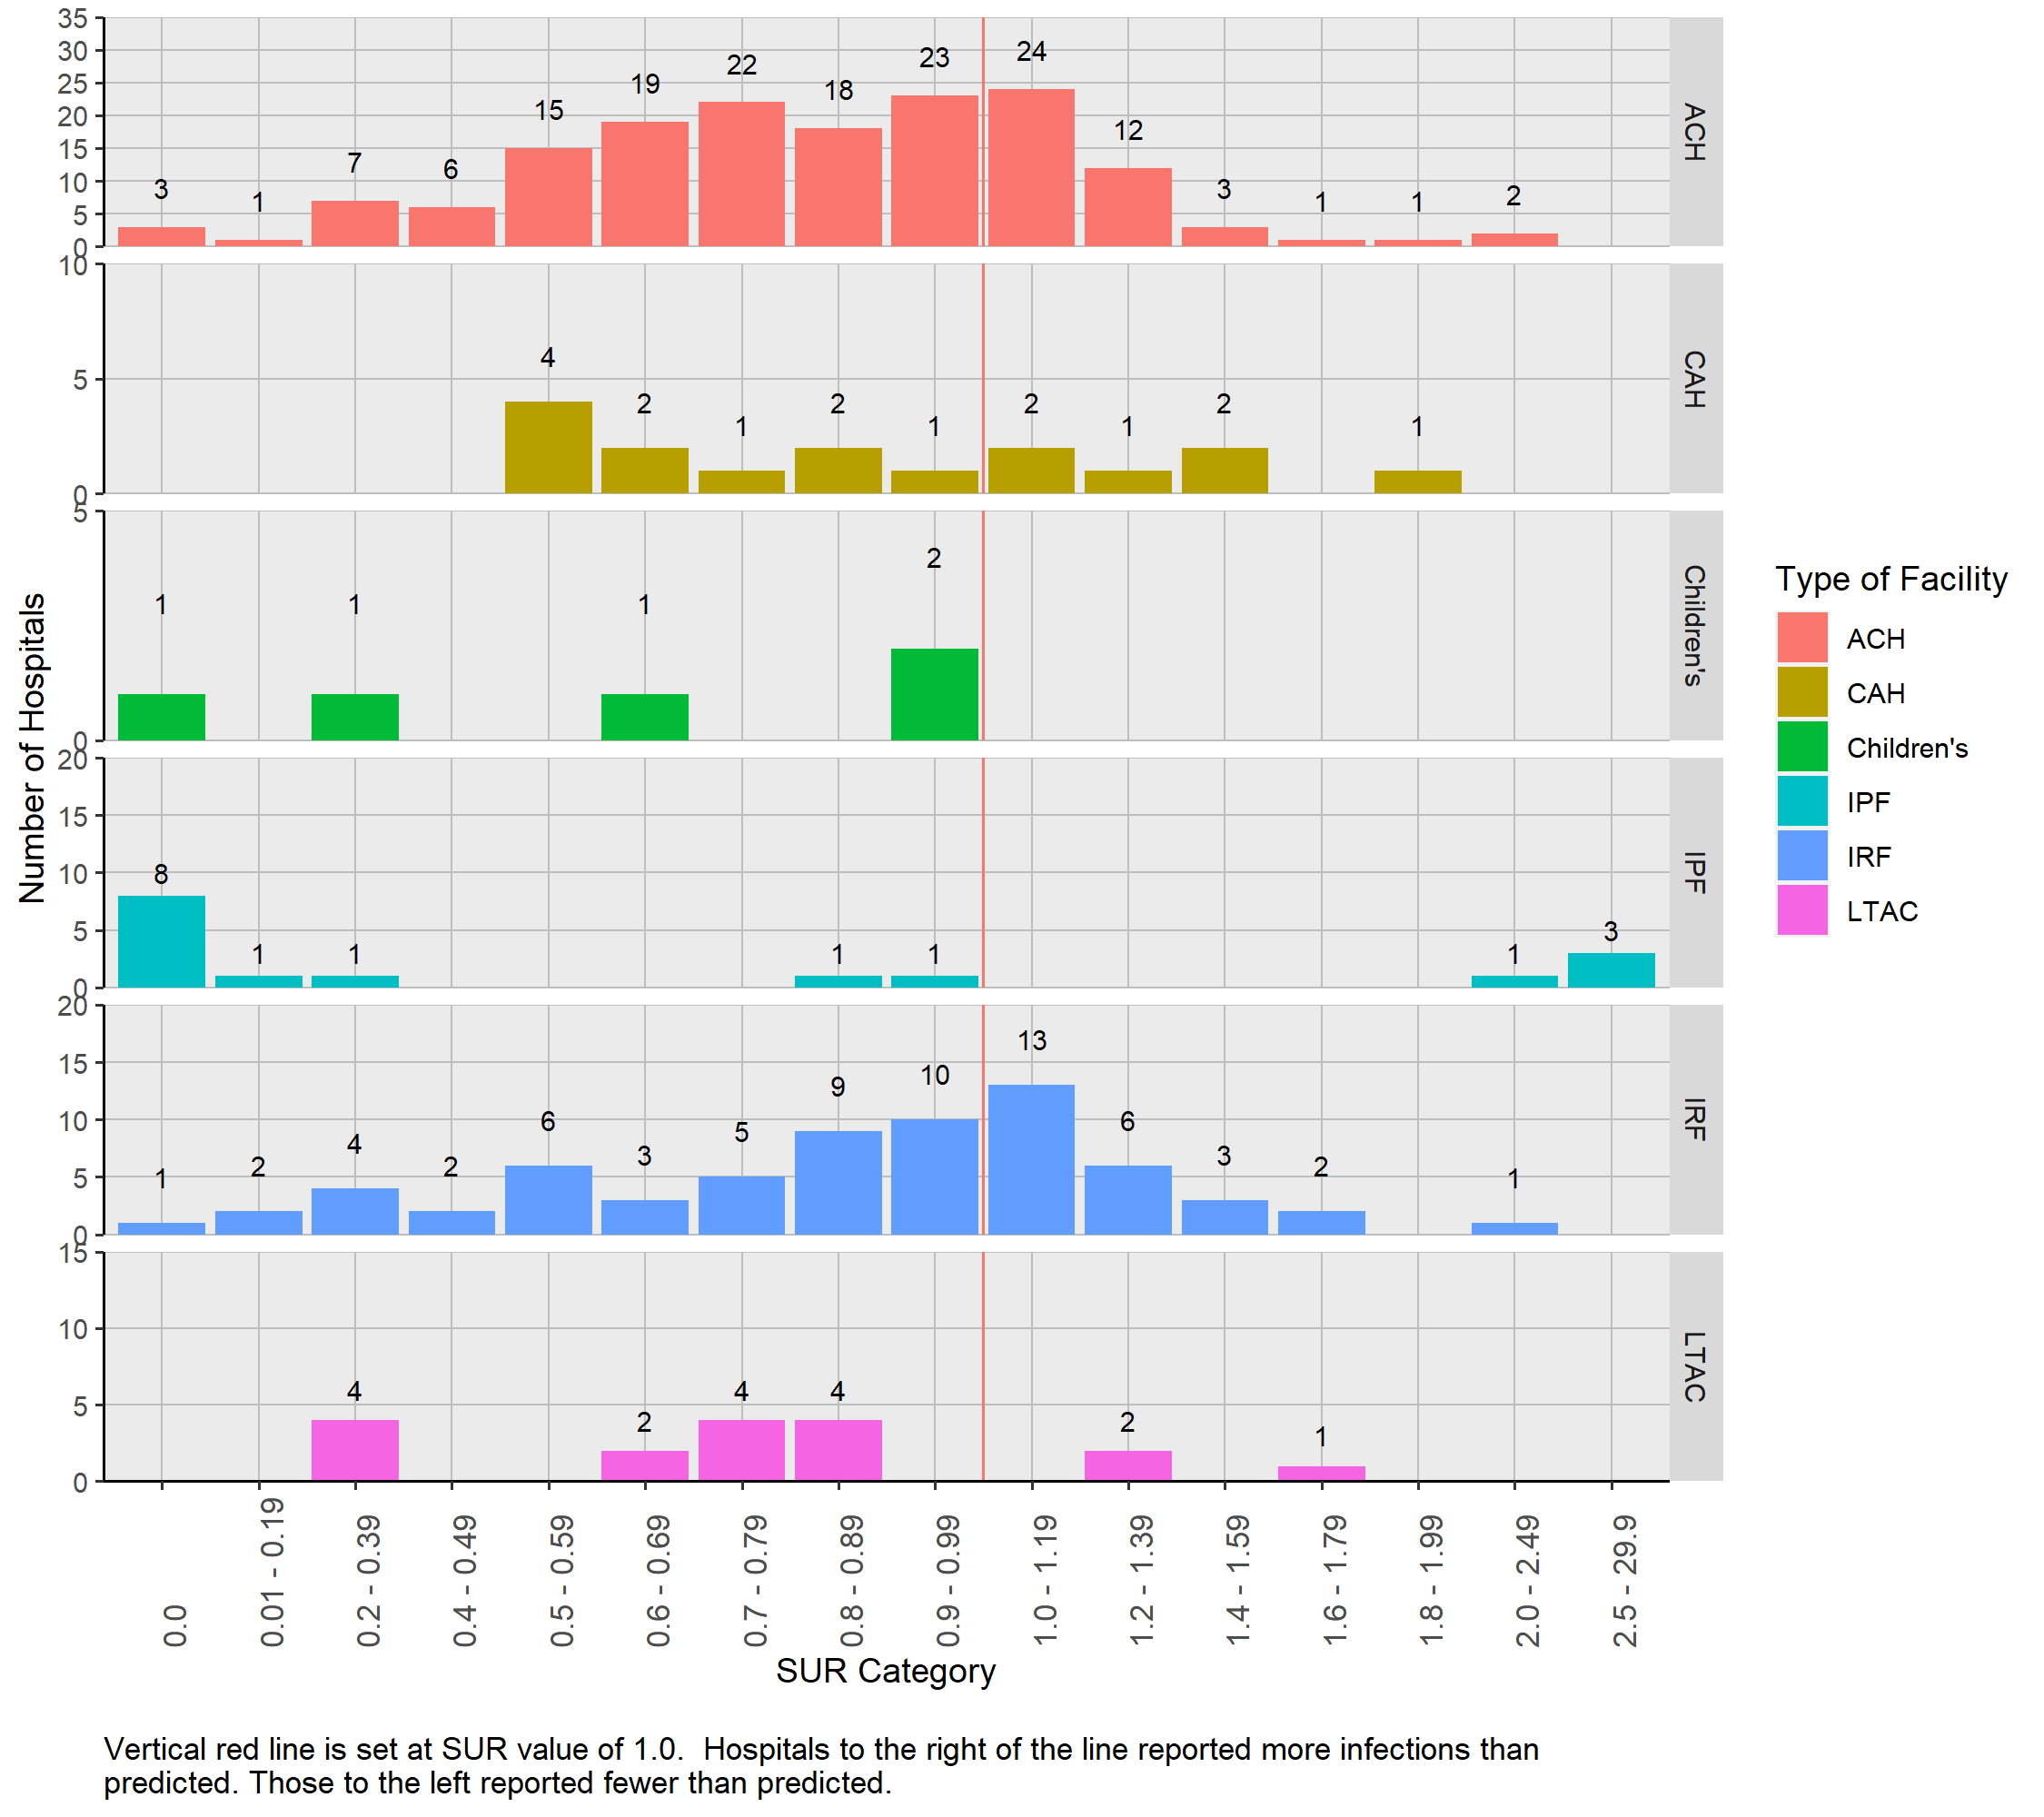
Figure 1 displays the distribution of hospital specific SIR values (N= 160) grouped by hospital type. No IPFs or CAHs had 1.0 or more predicted infection and these facility types are not included in the figure. The hospital specific CAUTI SIR values were dispersed and ranged from 0 to 5.09. Thirteen (8.1%) of the SIR values were 2.0 or larger. One hundred nine (68.1%) facilities had SIR values less than 1.0.
Figure 1: Distribution of CAUTI SIRs by Hospital Type | Pennsylvania, 2020

4.1.4 Number of CAUTIs Among Hospitals With Less Than One Predicted Infection
For facilities that had less than 1.0 predicted CAUTI based on the 2015 national baseline data, a SIR could not be calculated. These facilities as well as the number of reported CAUTIs are listed in Table 3. Although a SIR could not be calculated, these facilities can be evaluated with caution in light of the number of reported CAUTIs. Of the 118 facilities with less than 1.0 predicted CAUTI, 89 reported zero infections. Although less than 1.0 CAUTI was predicted, 20 hospitals reported one infection, six hospitals reported two infections and three hospitals reported three or more infections.
Table 3: Number (Percent) of Hospitals with Zero, One, Two, or Three or More CAUTIs Stratified by Hospital Type among those with Less Than One Predicted Infection | Pennsylvania, 2020| Hospital Type | Number of Hospitals | Zero | One | Two | Three or more |
|---|---|---|---|---|---|
| ACH | 44 | 35 ( 79.5 %) | 7 ( 15.9 %) | 1 ( 2.3 %) | 1 ( 2.3 %) |
| CAH | 16 | 12 ( 75 %) | 2 ( 12.5 %) | 2 ( 12.5 %) | 0 ( 0 %) |
| Children’s | 3 | 3 ( 100 %) | 0 ( 0 %) | 0 ( 0 %) | 0 ( 0 %) |
| IPF | 16 | 15 ( 93.8 %) | 1 ( 6.2 %) | 0 ( 0 %) | 0 ( 0 %) |
| IRF | 39 | 24 ( 61.5 %) | 10 ( 25.6 %) | 3 ( 7.7 %) | 2 ( 5.1 %) |
| Total | 118 | 89 ( 75.4 %) | 20 ( 16.9 %) | 6 ( 5.1 %) | 3 ( 2.5 %) |
4.1.5 CAUTI Measures by Hospital
Table 4 lists the 278 hospitals and relevant CAUTI data, as well as the county where the hospital is located. Twenty-three hospitals (8.3%) had SIR values of zero, meaning that no CAUTIs were reported and more than 1.0 was predicted. The corresponding predicted number of CAUTIs ranged between 1.0 and 7.1 for those hospitals.
Twenty-five hospitals (identified by blue font) reported statistically significantly fewer CAUTIs than were predicted in the 2015 national baseline, meaning that their SIR was less than 1.0. Nine of these hospitals reported no infections, although the predicted number of infections ranged between 3.2 and 7.1. Among the remaining 16 hospitals where at least one CAUTI was reported, the range of predicted CAUTIs was 9.2 to 88.7.
Ten hospitals (identified by red font) reported statistically significantly more CAUTIs than were predicted in the 2015 national baseline, meaning that their SIR was more than 1.0. Six of these hospitals reported less than five predicted CAUTIs.
Table 4: List of Hospitals with CAUTI SIRs and Associated Measures | Pennsylvania, 2020 Hospitals printed in red reported statistically significantly more CAUTIs than predicted. Hospitals printed in blue reported statistically significantly fewer CAUTIs than predicted.
4.2 Urinary Catheter SUR
The urinary catheter SUR for Pennsylvania was 0.84 (95% CI: (0.84, 0.85)). This is 15.5% lower than the 2015 national baseline. Urinary catheter days data was reported from 278 facilities of which all facilities had a SUR value calculated. Thirteen reported no urinary catheter days, 37 hospitals reported between 1 and 200 urinary catheter days, 75 reported between 201 and 1,000 urinary catheter days, 77 reported between 1,001 and 5,000 urinary catheter days, 40 hospitals reported between 5,001 and 10,000 urinary catheter days, and the remaining 36 reported more than 10,000 urinary catheter days.
4.2.0.1 Urinary Catheter Measures by Type of Hospital
Table 5 lists the SUR, reported and predicted urinary catheter use days for different types of hospitals. All facility types had statistically significantly lower SUR values than predicted.
Table 5: Urinary Catheters SURs by Hospital Type | Pennsylvania, 2020
4.2.1 Distribution of Urinary Catheter SUR Values by Type of Hospital
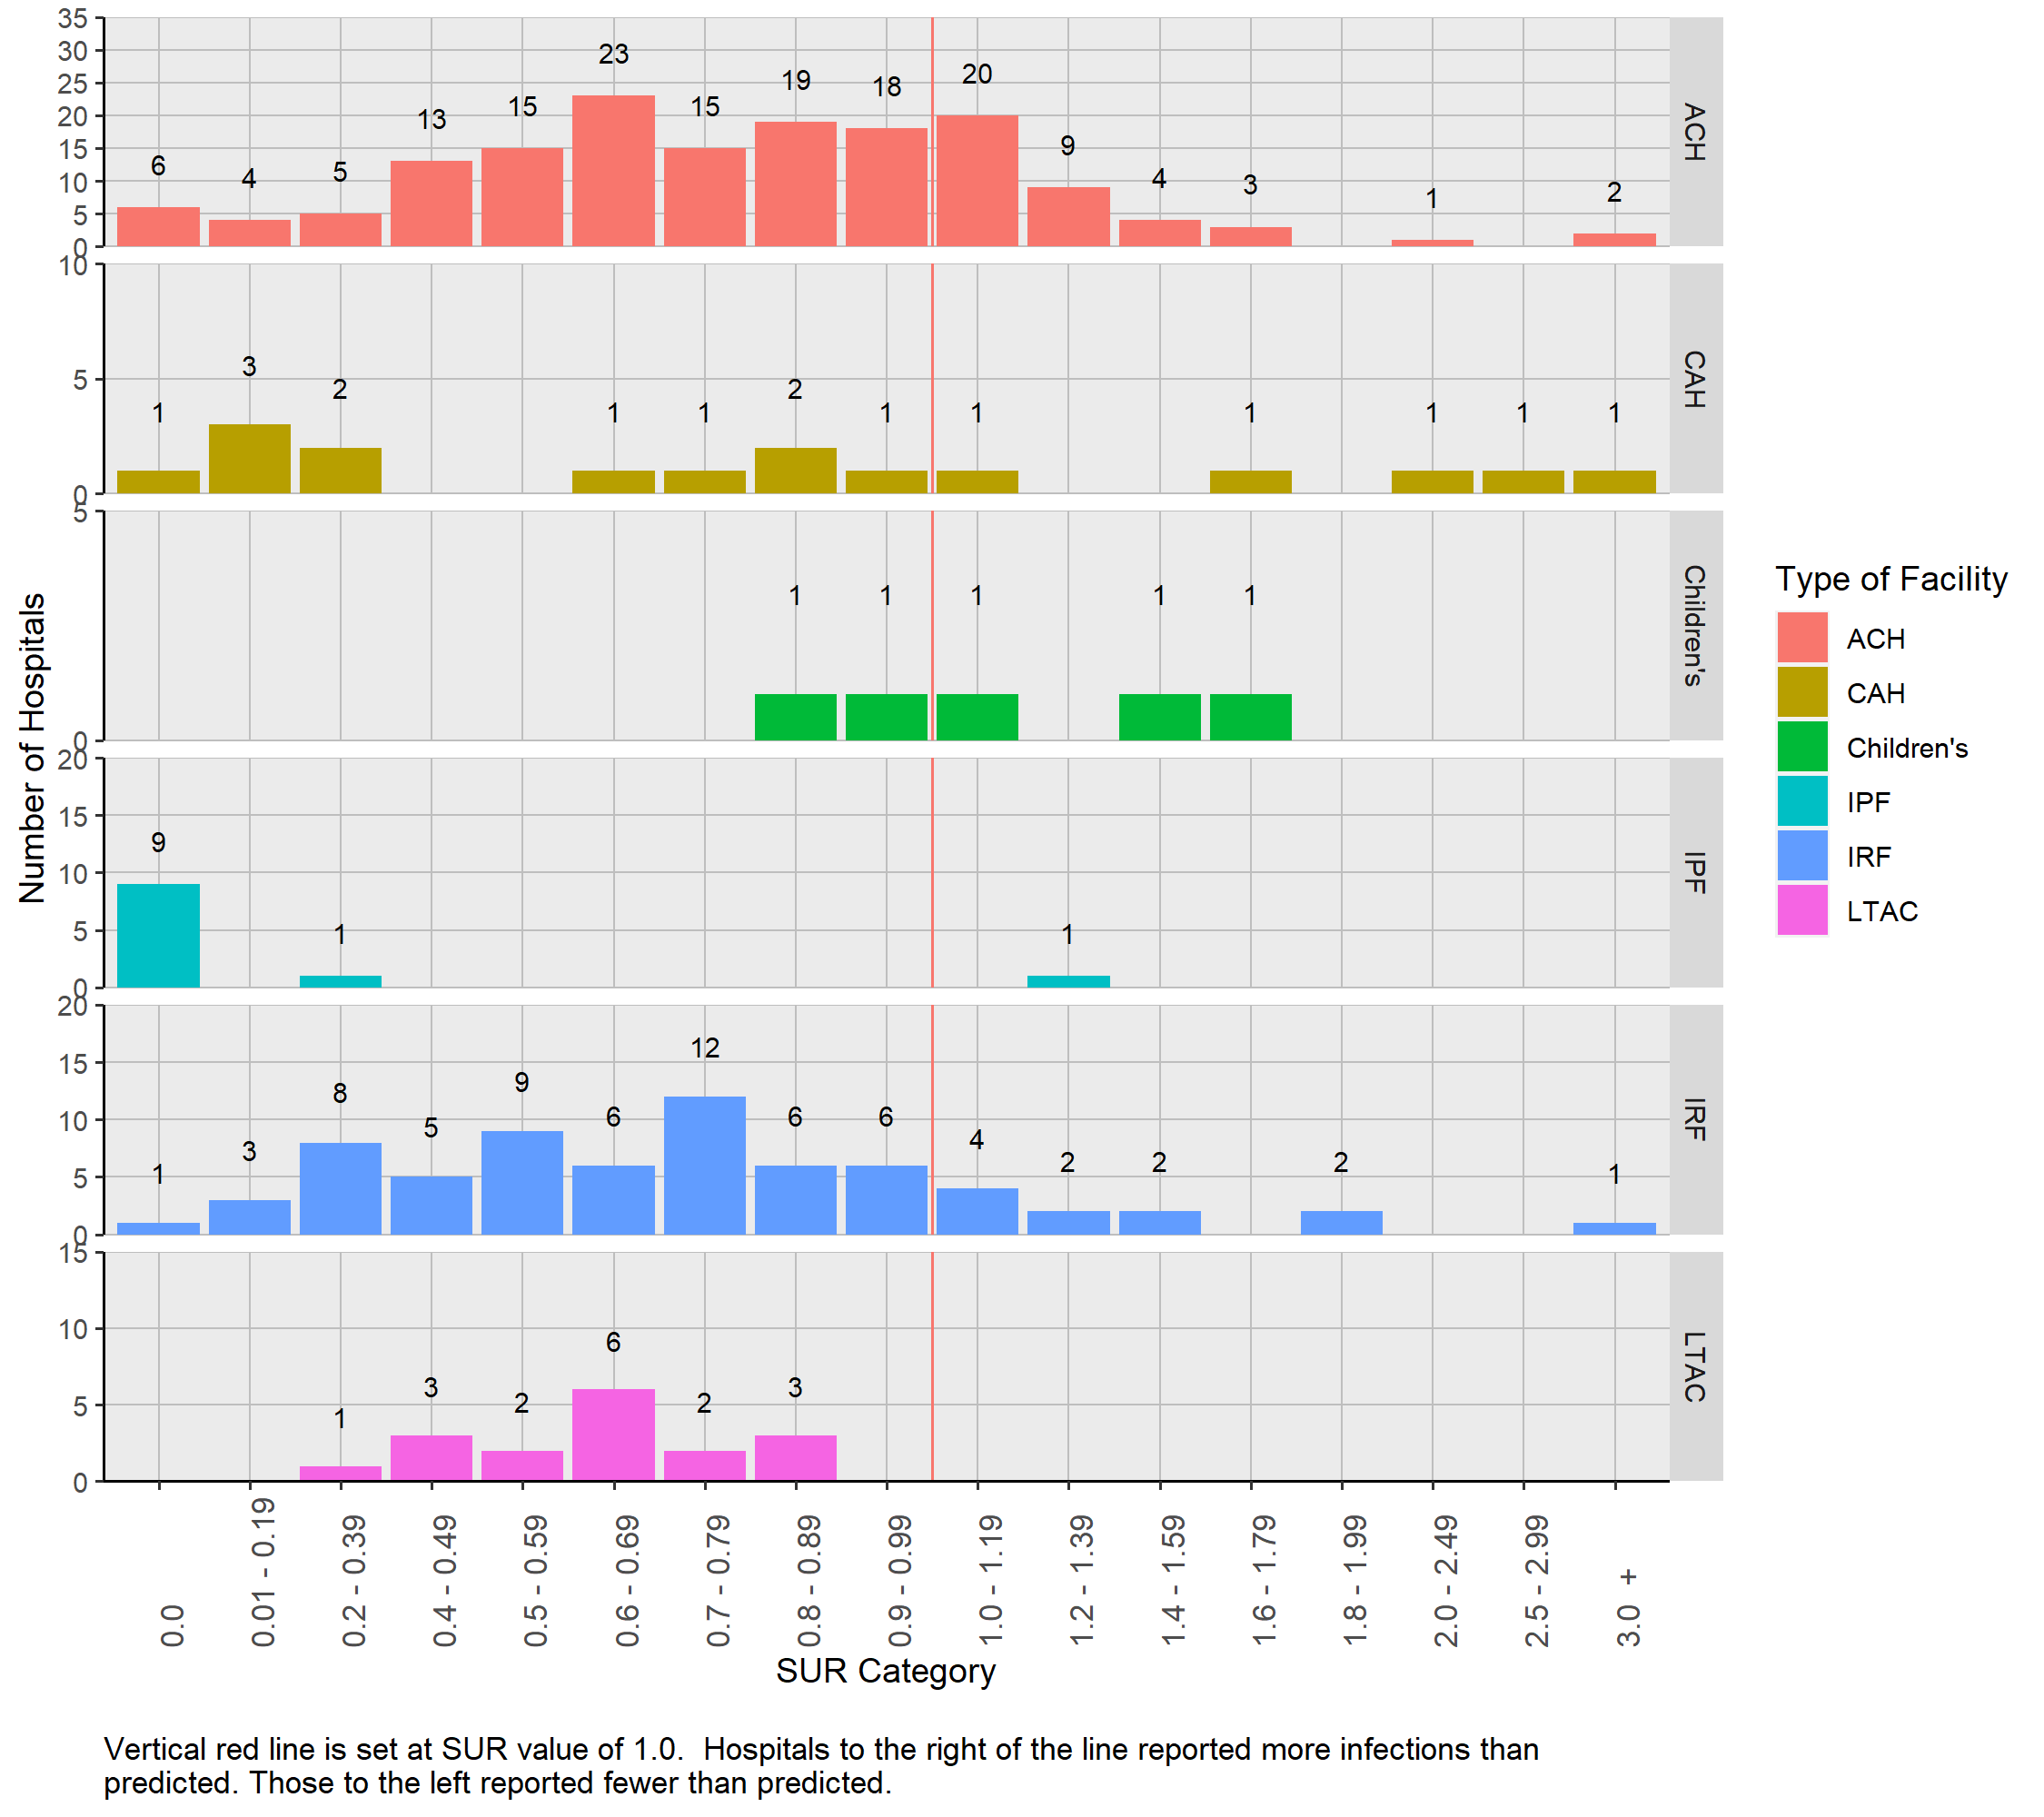
Figure 2 shows that the hospital-specific urinary catheter SUR values were dispersed and ranged from 0 to 29.93. One hundred ninety-seven (70.9%) of the 278 hospitals had SUR values less than one. Three IPFs had SURs more than 2.5 (SUR: 5.5, 9.6 and 29.9), meaning that urinary catheters were used more than two and one half times as often than those of similar hospitals from the 2015 national baseline. One of those facilities reported one CAUTI. One hundred ninety-seven (70.9%) facilities had SIR values less than 1.0.
Figure 2: Distribution of Urinary Catheter SURs by Hospital Type | Pennsylvania, 2020
4.2.2 Urinary Catheter Measures by Hospital
Table 6 shows the reported and predicted number of urinary catheter days, SUR values and 95% CIs for each hospital. The number of predicted urinary catheter days in hospitals ranged from nine to 49,965, and the reported urinary catheter days ranged from zero to 53,097. Examination of the hospitals with the highest 10 SUR values shows that eight had less than 2,000 predicted urinary catheter days.
Table 6: List of Hospitals with Urinary Catheter SURs by Hospital Name | Pennsylvania, 2020
Hospitals printed in red reported statistically significantly more urinary catheter days than predicted. Hospitals printed in blue reported statistically significantly fewer urinary catheter days than predicted.
4.3 CLABSI
4.3.1 CLABSI SIR
In 2020, 1,213 CLABSIs were reported from 274 hospitals. Statistically, the state SIR value is significantly lower than the 2015 national baseline (SIR: 0.84; 95% CI: (0.79, 0.88)). The number of reported CLABSIs in 2020 was 240 fewer CLABSIs than predicted using the 2015 national baseline data and 217 more than were reported in 2019.
Of the 10 hospitals with the greatest number of predicted infections, four had a lower statistically significant SIR than the 2015 national baseline. The SIR values from six other hospitals were not statistically significantly different from the 2015 national baseline data. Together these six hospitals reported 368 CLABSIs. This was 30% of all CLABSIs in the state and yet only 25% of the number predicted infections in the state were predicted to come from these hospitals.
4.3.2 CLABSI Measures by Type of Hospital
As seen below in Table 7, the majority of CLABSIs were reported in ACHs (963 of 1,213). Overall, the ACHs performed 18% better than hospitals from the 2015 national baseline (SIR: 0.82; 95% CI: (0.77, 0.88)). Long term acute care hospitals also reported statistically significantly fewer reported CLABSIs than predicted by the 2015 national baseline (SIR: 0.75; 95% CI: (0.61, 0.91)). Children’s hospitals and CAHs reported nearly the same number of CLABSIs as predicted (N = 128 and N = 1, respectively). No CLABSIs were reported from IPFs and less than 1.0 were predicted. Inpatient rehabilitation facilities had a SIR similar to that of ACHs (SIR: 0.81) but it was not statistically significant.
Table 7: Summary of CLABSI Measures Stratified by Hospital Type | Pennsylvania, 2020
4.3.3 Distribution of CLABSI SIR Values by Type of Hospital
Figure 3 displays the distribution of hospital specific CLABSI SIR values (N=133) grouped by hospital type. Hospital-specific SIR values were not calculated for CAHs and IPFs because the number of predicted CLABSIs was less than 1.0. Ten (7.5%) of the SIR values were 2.0 or larger. Ninety-one (68.4%) facilities had SIR values less than 1.0.
Figure 3: Distribution of CLABSI SIRs by Hospital Type | Pennsylvania, 2020

4.3.4 Number of CLABSIs Among Hospitals With Less Than One Predicted Infection
For facilities that had less than 1.0 predicted CLABSI based on the 2015 national baseline data, a SIR could not be calculated. These facilities as well as the number of reported CLABSIs are listed in Table 8. Although a SIR could not be calculated, these facilities can be evaluated with caution in light of the number of reported CLABSIs. Of the 141 facilities with less than 1.0 predicted CLABSI, 120 reported zero infections. Although less than 1.0 CLABSI was predicted, 17 hospitals reported one infection, two hospitals reported two infections and two hospitals reported three or more infections.
Table 8: Number (Percent) of Hospitals with Zero, One, Two, or Three or More CLABSIs Stratified by Hospital Type among those with Less Than One Predicted Infection | Pennsylvania, 2020| Hospital Type | Number of Hospitals | Zero | One | Two | Three or more |
|---|---|---|---|---|---|
| ACH | 52 | 41 ( 78.8 %) | 8 ( 15.4 %) | 2 ( 3.8 %) | 1 ( 1.9 %) |
| CAH | 16 | 15 ( 93.8 %) | 1 ( 6.2 %) | 0 ( 0 %) | 0 ( 0 %) |
| Children’s | 2 | 2 ( 100 %) | 0 ( 0 %) | 0 ( 0 %) | 0 ( 0 %) |
| IPF | 12 | 12 ( 100 %) | 0 ( 0 %) | 0 ( 0 %) | 0 ( 0 %) |
| IRF | 59 | 50 ( 84.7 %) | 8 ( 13.6 %) | 0 ( 0 %) | 1 ( 1.7 %) |
| Total | 141 | 120 ( 85.1 %) | 17 ( 12.1 %) | 2 ( 1.4 %) | 2 ( 1.4 %) |
4.3.5 CLABSI Measures by Hospital
Table 9 lists CLABSI data, as well as county location of hospital from 274 hospitals. Twenty-five hospitals (identified by blue font) reported statistically significantly fewer CLABSIs than were predicted in the 2015 national baseline, meaning that their SIR was less than 1.0. Six of these hospitals reported no infections, although the predicted number of infections ranged between 3.4 and 7.9. Among the remaining 19 hospitals where at least one CLABSI was reported, the range of predicted CLABSIs was 6.7 to 80.8. Ten hospitals (identified by red font) reported statistically significantly more CLABSIs than were predicted in the 2015 national baseline, meaning that their SIR was more than 1.0. Five of these hospitals reported less than five predicted CLABSIs.
Table 9: List of Hospitals with CLABSI SIRs and Associated Measures | Pennsylvania, 2020
Hospitals printed in red reported statistically significantly more CLABSIs than predicted. Hospitals printed in blue reported statistically significantly fewer CLABSIs than predicted.
4.4 Central Line SUR
The central line SUR was calculated for all the facilities that reported data. The state SUR was 0.83 (95% CI: (0.83, 0.83)) which is 16.8% less use than predicted by the 2015 national baseline. In 2019 the SUR was 0.80 (95% CI: (0.80, 0.80)).
Eighteen hospitals reported no central line days, 45 hospitals reported between one and 200 central line days, 62 reported between 201 and 1,000 central line days, 87 reported between 1,001 and 5,000 central line days, 33 hospitals reported between 5,001 and 10,000 central line days, and the remaining 29 reported more than 10,000 central line days.
4.4.1 Central Line Use Measures by Type of Hospital
Table 10 lists reported and predicted central line days and SUR values stratified by hospital type. Central line catheters were most frequently used in ACHs (N = 1,138,296 days.)
Critical access hospitals in Pennsylvania, as a group, used central lines 11% more often than similar hospitals from the 2015 national baseline (SUR: 1.11; 95% CI: (1.07, 1.14)). All other facility types used central lines less than similar hospitals from the 2015 national baseline and the SUR values reached statistical significance.
Table 10: Central line SURs by Hospital Type | Pennsylvania, 2020
4.4.2 Distribution of Central Line SUR Values by Type of Hospital
Figure 4 shows that the hospital-specific central line SUR values were dispersed and ranged from 0 to 17. Two hundred fourteen (78.4%) of the 273 hospitals with more than 1 predicted central line day had a SUR value less than 1.0. Seven hospitals had SUR values more than 2.0. One of these hospitals reported one CLABSI and another reported two CLABSIs.
Figure 4: Distribution of Central Line SURs by Hospital Type | Pennsylvania, 2020
4.4.3 Central Line Measures by Hospital
Table 11 shows that the number of predicted central line days in hospitals ranged from 0 to 67,642, and the reported central line days ranged from 0 to 78,833. Examination of the hospitals with the highest 10 SURs shows that all had less than 2,000 predicted central line days.
Table 11: List of Hospitals with Central Line SURs by Hospital Name | Pennsylvania, 2020
Hospitals printed in red reported statistically significantly more central line days than predicted. Hospitals printed in blue reported statistically significantly fewer central line days than predicted.
4.5 SSIs
4.5.1 Description of Surgical Procedures
This 2020 report includes HAIs that were reported following seven surgical procedure types: KPRO and HPRO, HYST, COLO, CARD, CBGB and CBGC. After applying the exclusion criteria, a total of 99,908 surgical procedures were performed in 164 hospitals. As a reminder, patients who had surgical procedures but did not spend the night in the hospital were excluded because this type of procedure was classified as an outpatient procedure, not an inpatient procedure.
Table 12 shows that 52 hospitals performed all seven surgeries. Table 13 shows the number of surgeries that were performed at each hospital for each surgical procedure type in 2020.
Table 12: Distribution of Surgeries Performed at Hospitals | Pennsylvania, 2020
| Number of Hospitals | Knee Replacement | Hip Replacement | Abdominal Hysterectomy | Colon | Cardiac Surgery | CBG Surgery 1 incision | CBG Surgery 2 incisions |
|---|---|---|---|---|---|---|---|
| 56 | X | X | X | X | |||
| 52 | X | X | X | X | X | X | X |
| 16 | X | X | X | ||||
| 10 | X | X | |||||
| 10 | X | X | X | X | X | ||
| 5 | X | X | |||||
| 3 | X | X | X | ||||
| 2 | X | ||||||
| 2 | X | ||||||
| 1 | X | X | |||||
| 1 | X | ||||||
| 1 | X | X | X | ||||
| 1 | X | X | X | ||||
| 1 | X | X | |||||
| 1 | X | X | X | ||||
| 1 | X | X | X | X | |||
| 1 | X | X | X | X | X | X |
Table 13: Number of Surgeries Performed at each Hospital | Pennsylvania, 2020
4.5.2 SIRs
Results presented in this section contain metrics using the “complex” model, which includes only deep tissue and organ space SSIs. SSI results that use the “all” model are presented in Appendix A. Superficial infections are not counted as cases in the “complex” model. For a more detailed description of the complex model, please refer to the SIR Guide Supplement48.
4.5.3 State SSI SIRs
Table 14 shows the number of surgeries performed in 2020, number of SSIs, number of predicted infections and respective SIR value for each surgical procedure. Knee replacement surgeries were the most commonly performed surgeries reported in NHSN with 34,285 performed during 2020. Coronary artery bypass grafting with two incisions and CBGC were only performed in ACHs. The SSI SIR values for the seven monitored surgical procedures range between 0.7 and 1.43. Pennsylvania hospitals reached the 2020 HHS goal of SIR = 0.70 for HYST SSIs.
The state-wide SSI SIR values for COLO and HYST were statistically significantly lower than the 2015 national baseline (COLO: SIR: 0.8; 95% CI: (0.72, 0.90), HYST SIR: 0.7; 95% CI: (0.53, 0.91). The SIR values for KPRO, HPRO and CBGB were close to 1.0 (KPRO SIR: 0.91, HPRO SIR: 0.98, CBGB SIR: 1.01) and not statistically different than the 2015 national baseline. Cardiac procedures are reported 14% less than the number predicted by the 2015 national baseline (SIR: 0.86) but not statistically different than the 2015 national baseline. The SIR value for CBGC is 43% statistically more than predicted by the 2015 national baseline (SIR: 1.43) and not statistically different than the 2015 national baseline.
Table 14: SSI Measures for Each of the Seven Surgical Procedures | Pennsylvania, 2020
4.5.4 SSI Measures by Type of Hospital
Because nearly all surgical procedures were performed in ACHs, calculation of the 2020 SSI SIR values stratified by hospital type is limited. Only CARD and COLO surgeries performed in children’s hospitals had more than 1.0 predicted SSI. These are presented in Table 15. Neither of the surgeries had a statistically significant SIR value that differed from the 2015 national baseline, although they both had a SIR value less than 1.0 (COLO SIR: 0.91, CARD SIR: 0.58).
Table 15: SIRs from Surgical-Procedure Combinations Commonly Performed in Specific Hospital Types | Pennsylvania, 2020
4.5.5 Distribution of SSI SIR Values by Type of Surgery
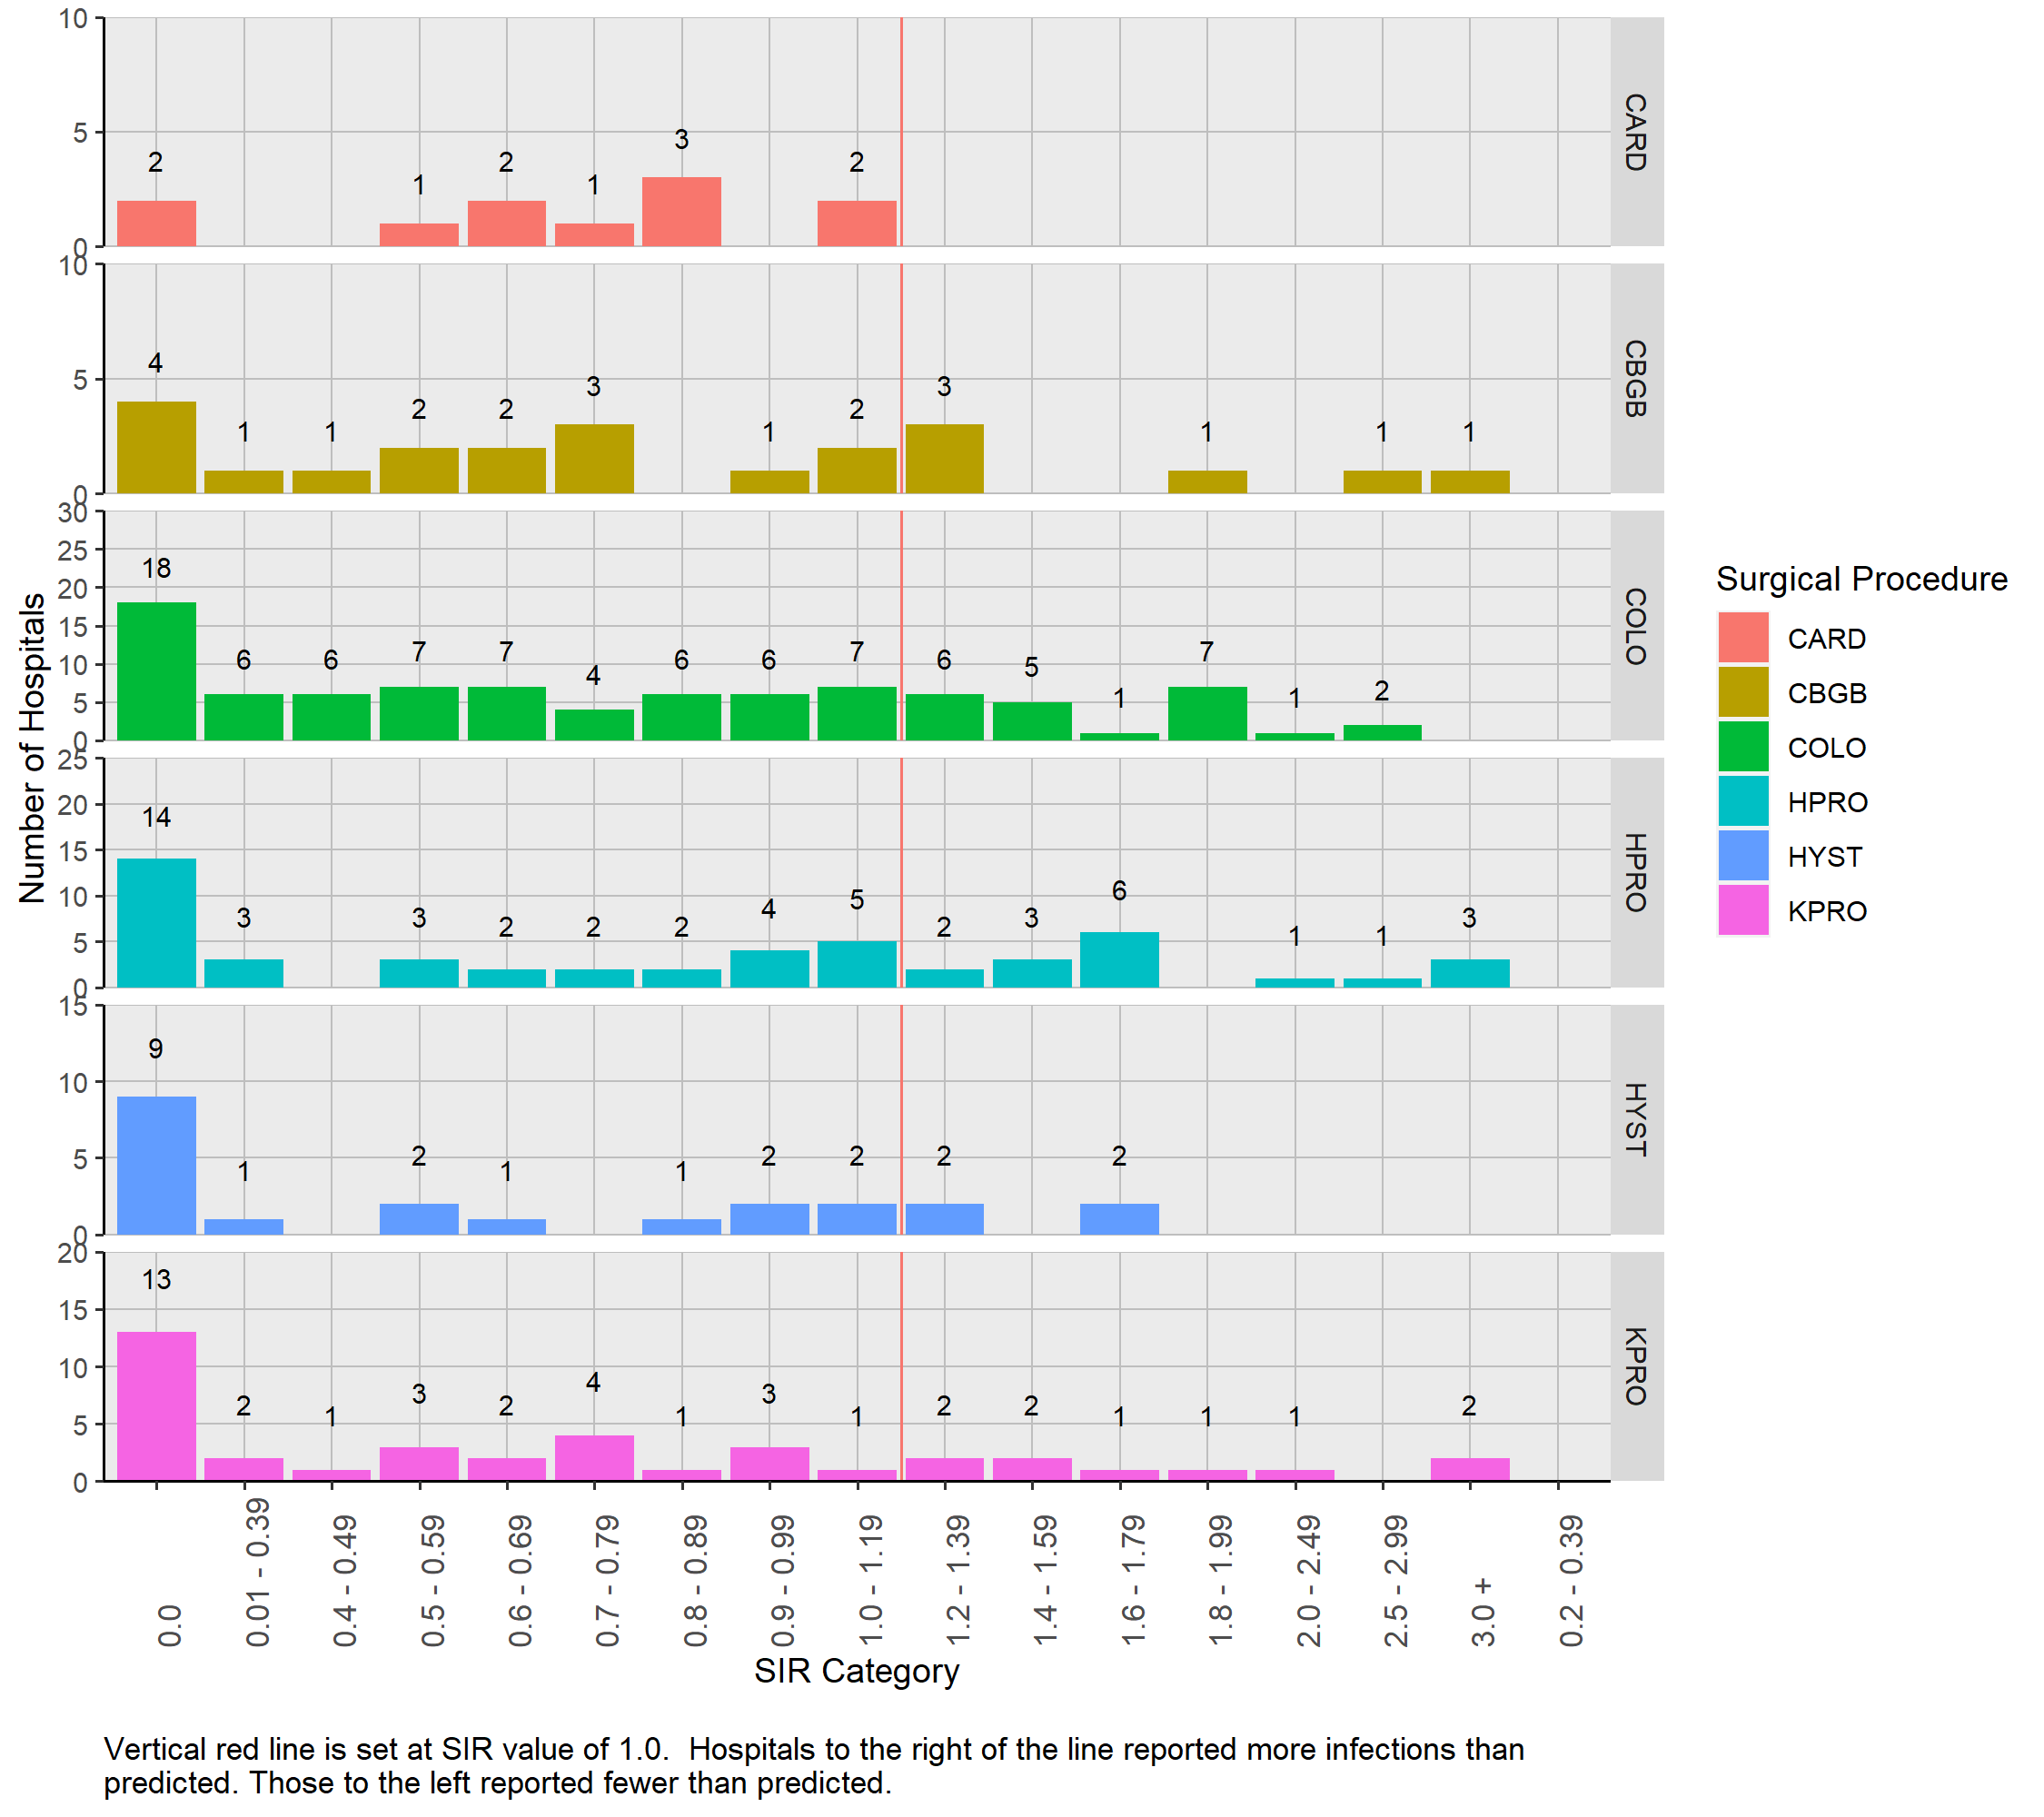
The distribution of 2020 SIR values for six surgery types is presented in Figure 5. Because the SIR was only calculated in those hospitals in which the predicted number of infections was 1.0 or more, 234 (31.1% of all) hospital-procedure pairs are included. No hospitals that performed CBGC had 1.0 or more predicted infection. This figure includes only four hospital surgery pairs from children’s hospitals and none from CAHs. The remaining SIR values are from ACHs. Thirteen (5.6%) of the SIR values were 2.0 or larger. One hundred fifty-eight (67.5%) facilities had SIR values less than 1.0.
Figure 5: Distribution of SIRs Stratified by Surgical Procedure Type| Pennsylvania, 2020
4.5.6 Number of SSIs Among Hospitals With Less Than One Predicted Infection by Type of Surgery
Table 16 shows the remaining 519 (68.9%) hospital-procedure pairs that have less than 1.0 predicted infection along with the number of SSIs that occurred. The table includes 28 hospital-procedure pairs from CAHs and six pairs from children’s hospitals. All but one of the procedures from these hospitals reported no SSIs.
Most of the hospital-procedure pairs had no reported SSIs (range: 64.5% to 82.9%). Between 1% and 1.9% of hospitals that performed CARD, COLO, HPRO and KPRO reported three or more infections even though less than 1.0 were predicted.
Table 16: Number (Percent) of Hospitals with Zero, One, Two, or Three or More SSIs Stratified by Surgical Procedure Type among those with Less Than One Predicted Infection | Pennsylvania, 2020| Surgical Procedure | Number of Hospitals | Zero | One | Two | Three or more |
|---|---|---|---|---|---|
| CARD | 54 | 45 ( 83.3 %) | 5 ( 9.3 %) | 3 ( 5.6 %) | 1 ( 1.9 %) |
| CBGB | 31 | 20 ( 64.5 %) | 6 ( 19.4 %) | 5 ( 16.1 %) | 0 ( 0 %) |
| CBGC | 53 | 45 ( 84.9 %) | 7 ( 13.2 %) | 1 ( 1.9 %) | 0 ( 0 %) |
| COLO | 58 | 46 ( 79.3 %) | 8 ( 13.8 %) | 3 ( 5.2 %) | 1 ( 1.7 %) |
| HPRO | 100 | 74 ( 74 %) | 16 ( 16 %) | 9 ( 9 %) | 1 ( 1 %) |
| HYST | 111 | 92 ( 82.9 %) | 19 ( 17.1 %) | 0 ( 0 %) | 0 ( 0 %) |
| KPRO | 112 | 85 ( 75.9 %) | 19 ( 17 %) | 6 ( 5.4 %) | 2 ( 1.8 %) |
| Total | 519 | 407 ( 78.4 %) | 80 ( 15.4 %) | 27 ( 5.2 %) | 5 ( 1 %) |
4.5.7 Statistically Significant SSI SIRs by Type of Surgery
Table 17 shows the number of hospitals with statistically significant SIR SSI values. Of the five surgical procedures shown in the table, more hospitals that performed CBGB, HPRO and KPRO had statistically significantly high SIR values than statistically significantly low SIR values. Among hospitals that performed COLO, seven hospitals have a statistically significant SIR value less than 1.0 and two hospitals have a statistically significant SIR value more than 1.0. One hospital that performed HYST has a SIR less than 1.0.
Table 17: Number of Hospitals with Statistically Significant SSI SIRs | Pennsylvania, 2020
4.5.8 SSI Measures by Hospital
Table 18 displays the comprehensive list of all hospital-surgical procedure pairs in which one or more of the surgeries was performed during 2020 (N= 753). SIR values are not calculated for hospitals with less than 1.0 predicted infection.
Table 18: Hospitals that Perform Seven Types of Surgeries and their SSI SIRs and Associated Measures | Pennsylvania, 2020
Hospitals printed in red reported statistically significantly more SSIs than predicted. Hospitals printed in blue reported statistically significantly fewer SSIs than predicted.
4.6 C. difficile Infections
C. difficile infection LabID events are the most common type of HAI reported in this report. All patients admitted to a hospital are at risk to get a CDI and each day in the hospital increases the chance of getting a CDI30. In 2020, 2,492 CDI events occurred, and 4,067 were predicted from the 2015 national baseline. This is 12.7% (N = 361) fewer than were reported in 2019. The state CDI SIR is 0.61 (95% CI: (0.59, 0.64)), which means that the number of CDI cases is 38.7% lower than the number predicted by the 2015 national baseline. Collectively, the state reached the 2020 HHS goal of attaining a 30% reduction (SIR = 0.70) in CDI events.
Of the 10 hospitals with the greatest number of predicted infections, seven had a lower statistically significant SIR than the 2015 national baseline. The SIR values from three other hospitals were not statistically significantly different from the 2015 national baseline data. Together these three hospitals had 353 CDIs. This is 14% of all CDIs in the state and yet only 9% of the number predicted infections in the state are predicted to come from these hospitals. Cumulatively, these three hospitals reported 75 more CDIs than in 2019.
4.6.1 CDI LabID Event Measures by Type of Hospital
As shown in Table 19, most CDI events (N = 2,255; 90%) were reported from ACHs and the SIR was 0.62 (95% CI: (0.59, 0.64)). This means that CDI events in 2020 were reported 38% less often than similar hospitals in the 2015 national baseline. Departmental guidance states that children’s hospitals, CAHs and IPFs are not required to report LabID events. The data reported here do not reflect CDI events from those facilities. The SIR in LTAC hospitals was 0.48 (95% CI: (0.38, 0.61)). Long-term acute care facilities had 74 fewer CDI events than predicted by the 2015 national baseline and seven fewer than were reported in 2019. The SIR in IRFs was 0.62 (95% CI: (0.53, 0.72)). Inpatient rehabilitation facilities reported 103 fewer CDI events than predicted by the 2015 national baseline and 11 less than were reported in 2019.
Table 19: C. difficile Infection Event SIRs by Hospital Type | Pennsylvania, 2020
4.6.2 Distribution of CDI LabID Event SIR Values by Type of Hospital
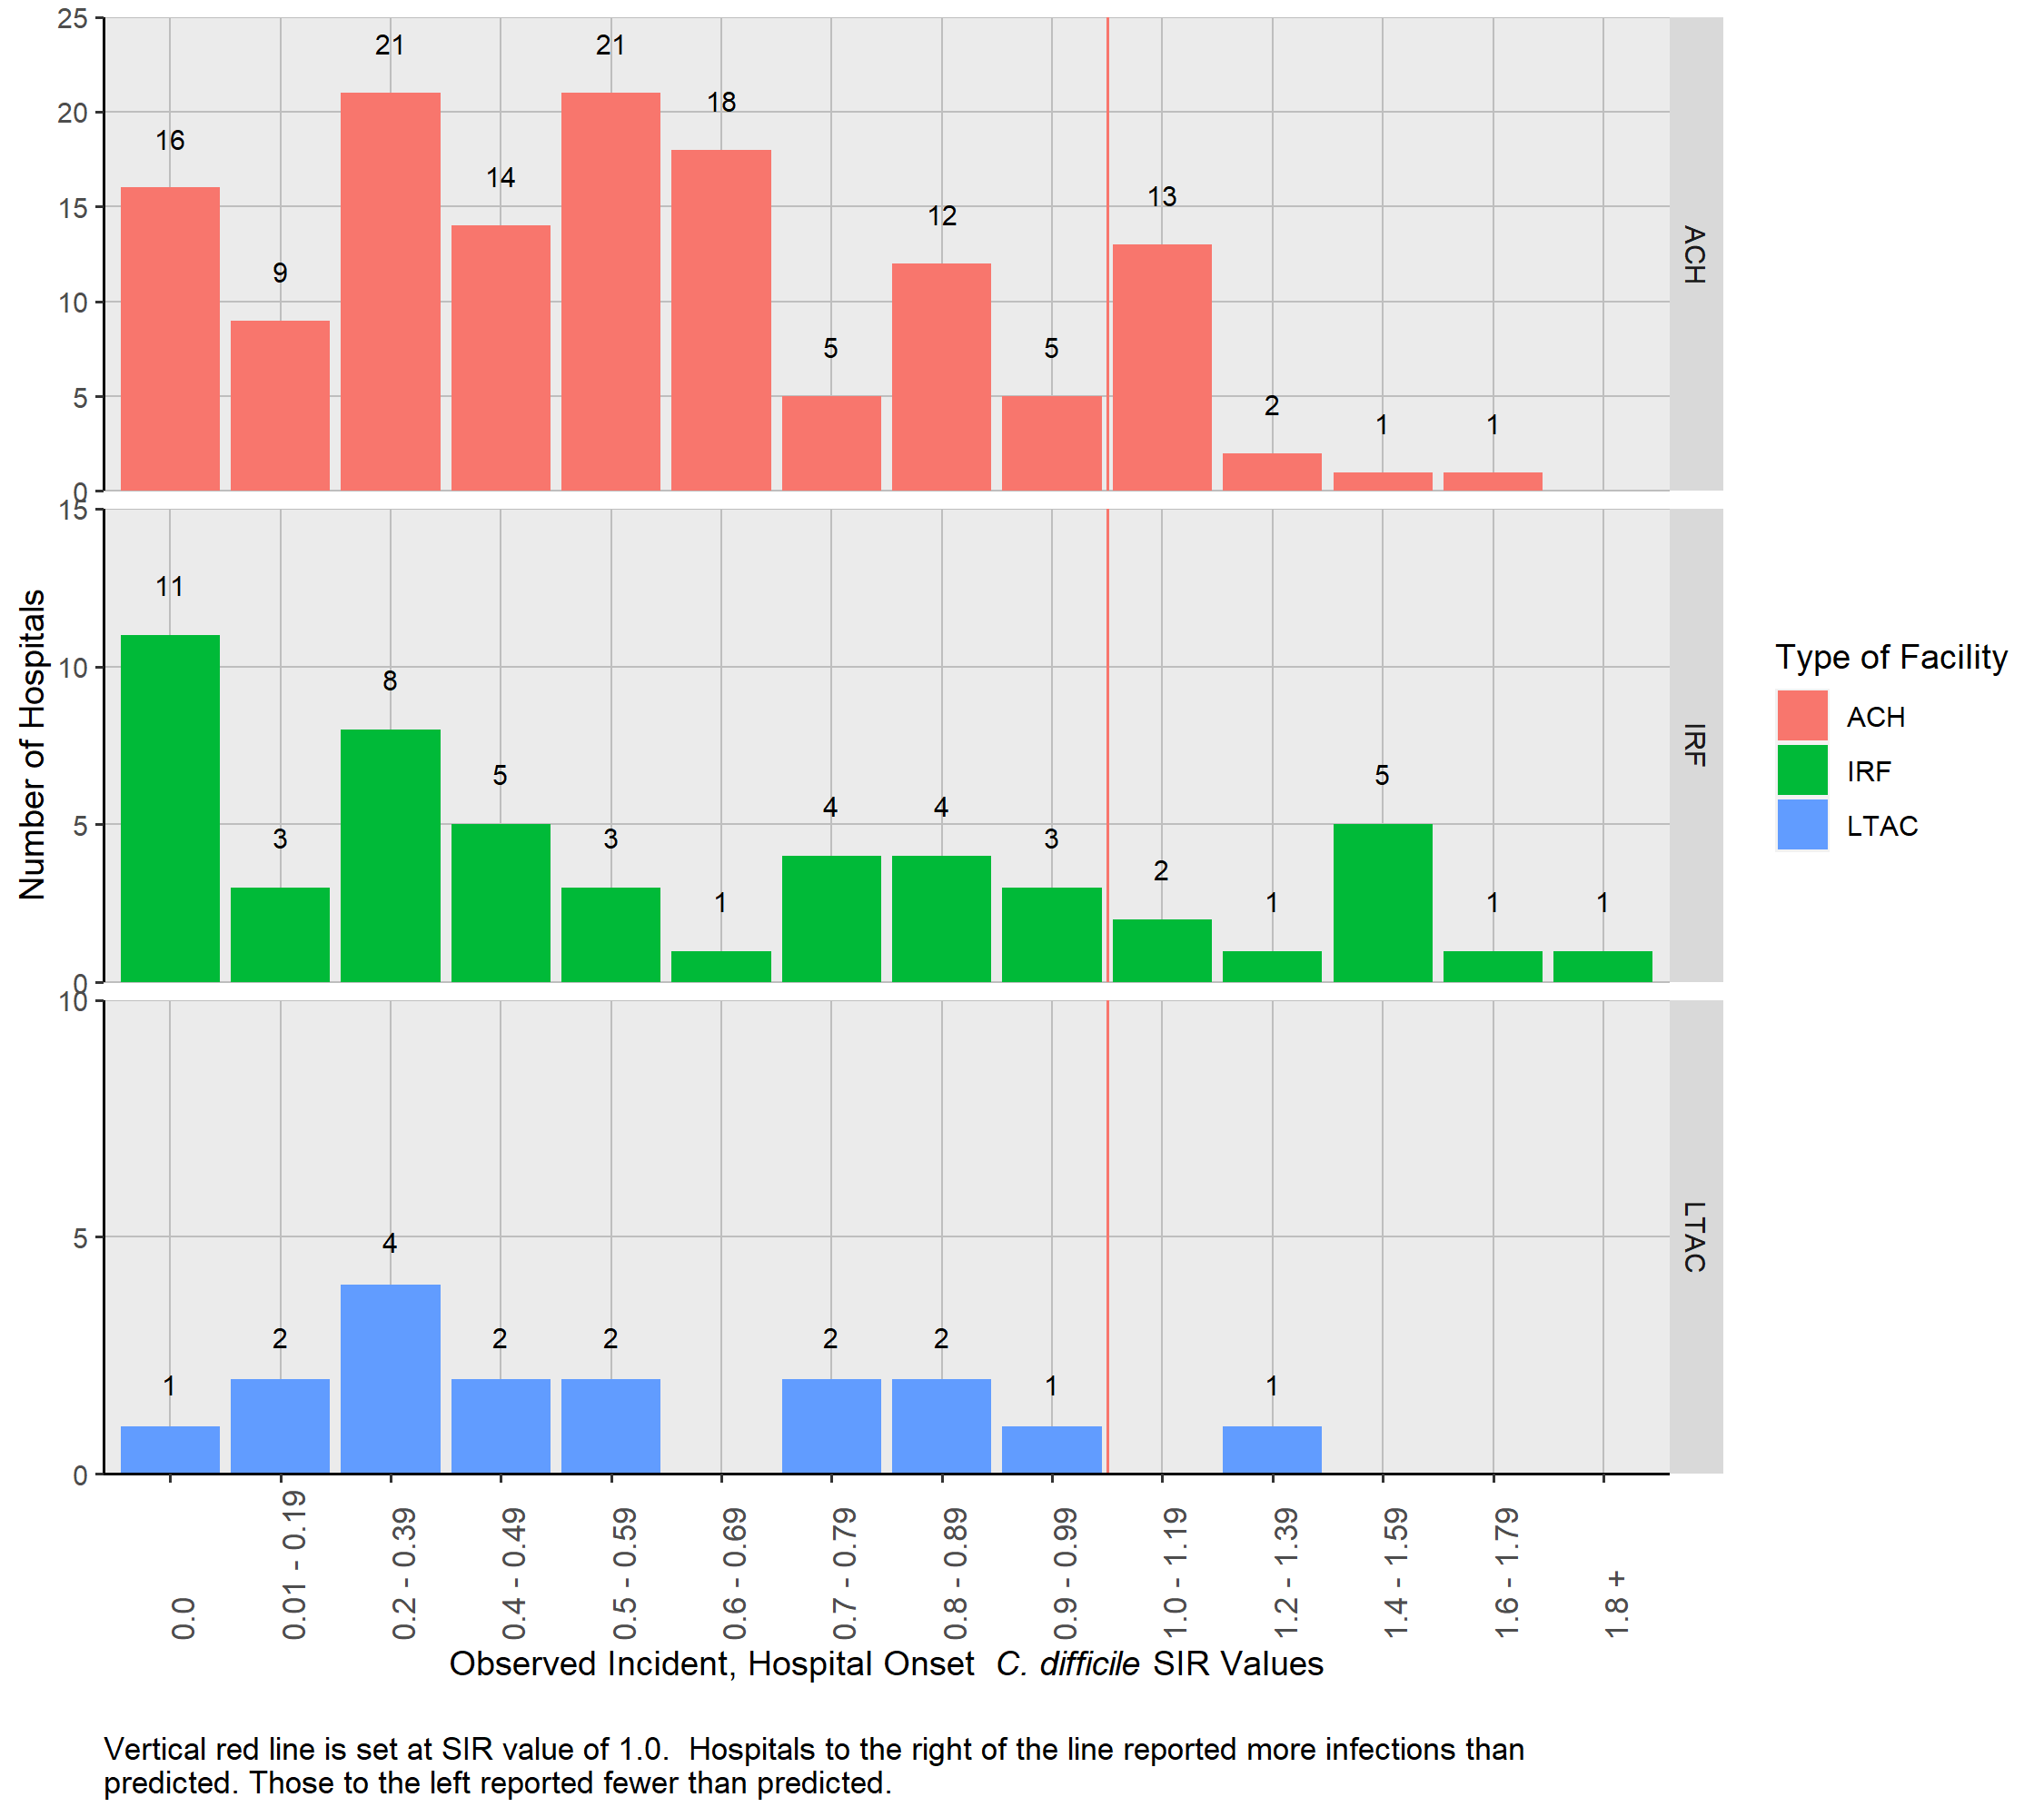
Figure 6 shows the distribution of CDI SIR values for ACH, LTAC hospitals, and IRFs among facilities with a SIR. The SIR values among the 207 hospitals with 1.0 or more predicted infections ranged from 0 to 1.98. The distribution among the 138 ACHs shows that most SIR values (N = 121, 87.7%) were less than one. All but one LTAC hospital have a SIR value less than one (N = 16, 94.1%). Eighty one percent (N=42) of IRFs have a SIR value less than one.
Figure 6: Distribution of C. difficile SIRs Stratified by Hospital Type| Pennsylvania, 2020
4.6.3 Number of CDI LabID Events Among Hospitals With Less Than One Predicted Infection
For facilities that had less than 1.0 predicted CDI LabID event based on the 2015 national baseline data, a SIR could not be calculated. These facilities as well as the number of reported CDI LabID events are listed in Table 20. Although a SIR could not be calculated, these facilities can be evaluated with caution in light of the number of reported CDI LabID events. Of the 34 facilities with less than 1.0 predicted CDI LabID event, 26 reported zero infections. Although less than 1.0 CDI LabID event was predicted, six hospitals reported one infection, one hospital reported two infections and one hospital reported three or more infections.
Table 20: Number (Percent) of Hospitals with Zero, One, Two, or Three or More CDIs Stratified by Hospital Type among those with Less Than One Predicted Infection | Pennsylvania, 2020| Hospital Type | Number of Hospitals | Zero | One | Two | Three or more |
|---|---|---|---|---|---|
| ACH | 19 | 17 ( 89.5 %) | 2 ( 10.5 %) | 0 ( 0 %) | 0 ( 0 %) |
| IRF | 15 | 9 ( 60 %) | 4 ( 26.7 %) | 1 ( 6.7 %) | 1 ( 6.7 %) |
| Total | 34 | 26 ( 76.5 %) | 6 ( 17.6 %) | 1 ( 2.9 %) | 1 ( 2.9 %) |
4.6.4 CDI LabID Event Measures by Hospital
Table 21 shows the number of CDI LabID events and the SIR for each Pennsylvania hospital that reported data (N=241). The type of CDI tests used by hospitals in 2020 is included in this table as a courtesy for facilities to evaluate CDI test methods used by their peers. The statistical models adjust for type of CDI test that was performed for each quarter of the year.
Twenty-eight hospitals had a SIR of 0.0, even though the number of predicted CDI events ranged between one and 22.1. Seventy-six hospitals (identified by blue font) had statistically significant SIR values that were less than 1.0, meaning that they reported fewer CDI events than predicted by the 2015 national baseline. Twelve of these hospitals reported no CDI events, although the predicted number ranged between three and 22.1. Among the remaining 64 hospitals where at least one CDI event was reported, the range of predicted CDIs was between 5.4 and 111.3. Only one hospital had a statistically significant elevated SIR value, meaning that more CDI events were reported than predicted during the 2015 national baseline.
Table 21: List of Hospitals with CDI Event SIRs by Hospital Name | Pennsylvania, 2020
Hospitals printed in red reported statistically significantly more CDI events than predicted. Hospitals printed in blue reported statistically significantly fewer CDI events than predicted.
4.7 MRSA Blood Infections
In 2020, 426 MRSA bloodstream LabID events were reported and 487.5 were predicted from the 2015 national baseline. This is 24.2% (N = 83) more than were reported in 2019. The state MRSA SIR was 0.87 (95% CI: (0.79, 0.96)).
Of the 10 hospitals with the greatest number of predicted infections only one had a statistically significantly lower SIR than the 2015 national baseline. The SIR values from the nine other hospitals were not statistically significantly different from the 2015 national baseline data. Together these nine hospitals reported 129 MRSA events. This is 30% of all MRSA events in the state and yet only 29% of the number predicted infections in the whole state were predicted to come from these hospitals.
4.7.1 MRSA LabID Event Measures by Type of Hospital
Table 22 lists patient days at risk, number of predicted and reported MRSA LabID events, and the SIR values for ACHs, LTAC, and IRFs. Acute care hospitals had statistically significantly fewer MRSA LabID events than predicted (SIR: 0.88; 95% CI: (0.80, 0.97)). Long term acute care hospitals reported 32% fewer MRSA LabID events than predicted by the 2015 national baseline and the SIR nearly reached statistically significance (SIR: 0.68; 95% CI: (0.40, 1.08)). Inpatient rehabilitation facilities reported one fewer MRSA LabID events than predicted by the 2015 national baseline (SIR: 0.94; 95% CI: (0.49, 1.63)).
Table 22: MRSA Blood Infections SIRs by Hospital Type | Pennsylvania, 2020
4.7.2 Distribution of MRSA LabID Event SIR Values by Type of Hospital
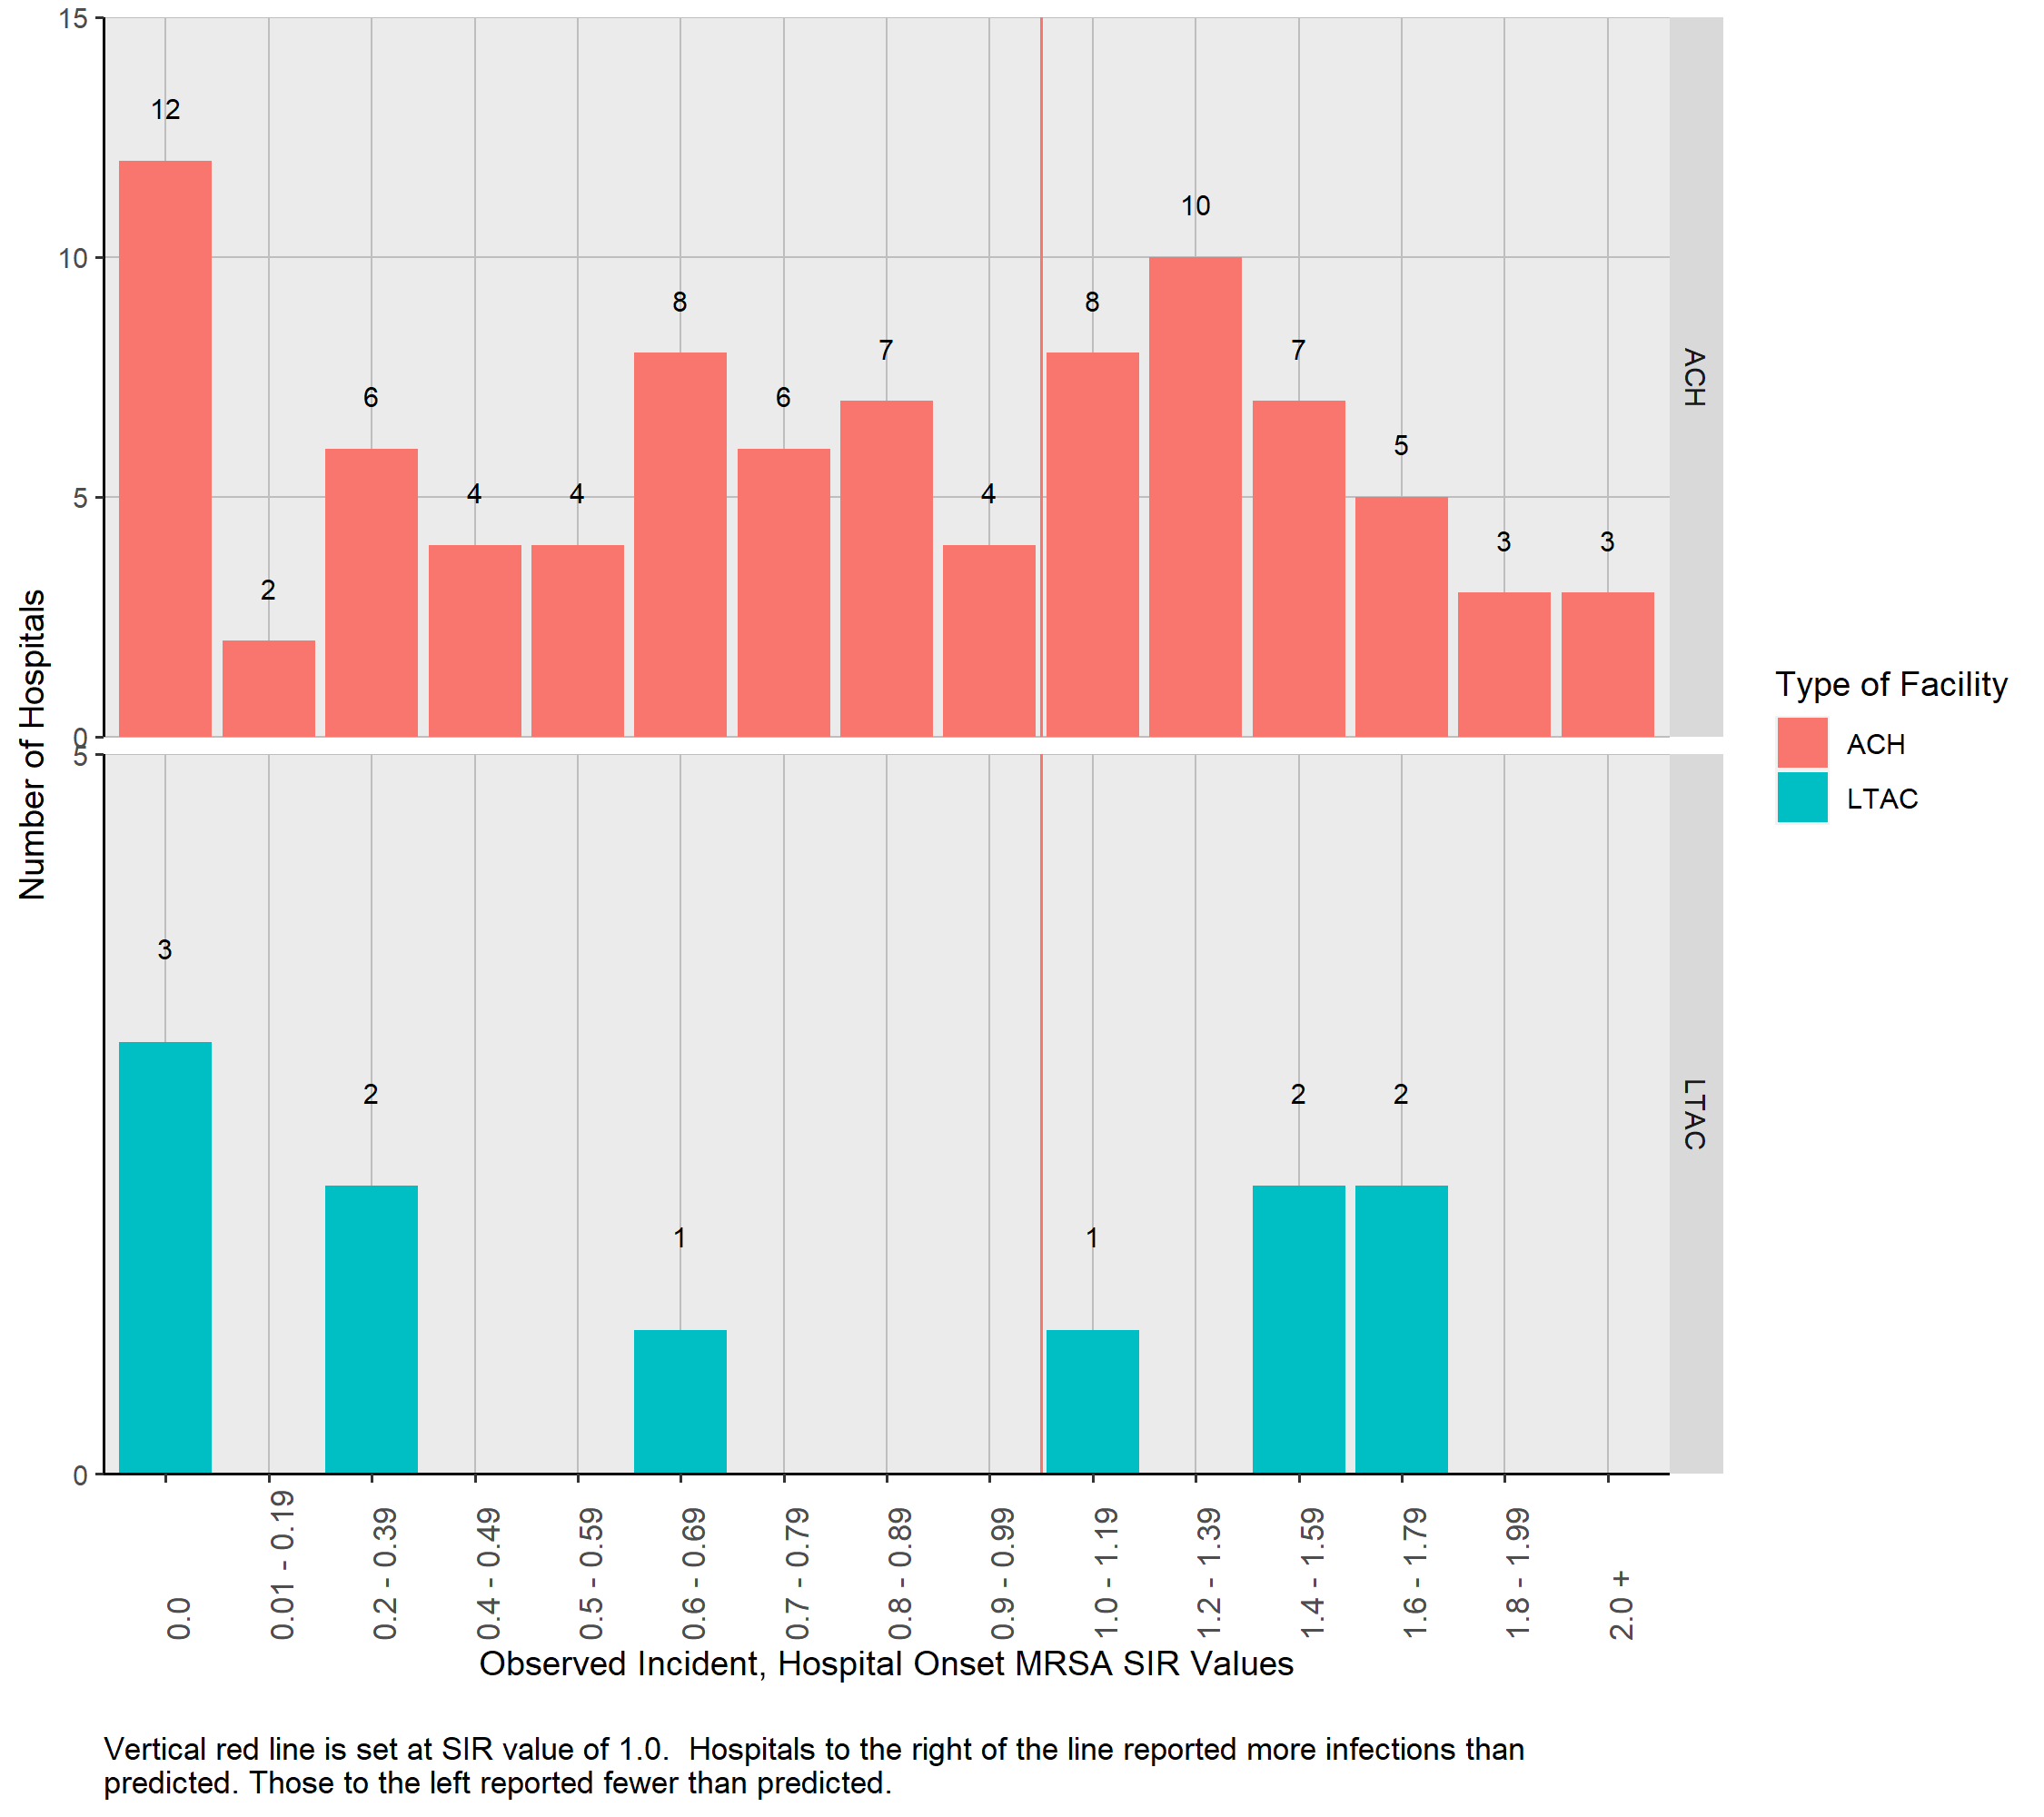
Figure 7 shows the distribution of MRSA LabID SIR values for ACHs and LTAC hospitals. All IRFs (N = 68) had less than 1.0 predicted infection and are not presented in this table. More than half (58.5%) of all hospitals with less than one predicted infection reported MRSA LabID data in 2020. The SIR values among 100 hospitals shown below range from 0.0 to 2.8. The distribution among the ACH shows that most SIR values (N= 53, 59.6%) are less than 1.0.
Figure 7: Distribution of MRSA Blood Infection SIRs Stratified by Hospital Type| Pennsylvania, 2020
4.7.3 Number of MRSA LabID Events Among Hospitals With Less Than One Predicted Infection
For facilities that had less than 1.0 predicted MRSA LabID event based on the 2015 national baseline data, a SIR could not be calculated. These facilities as well as the number of reported MRSA LabID events are listed in Table 23. Although a SIR could not be calculated, these facilities can be evaluated with caution in light of the number of reported MRSA LabID events. Of the 141 facilities with less than 1.0 predicted MRSA LabID event, 117 reported zero infections. Although less than 1.0 MRSA LabID event was predicted, 21 hospitals reported one infection, two hospitals reported two infections and one hospital reported three or more infections.
Table 23: Number (Percent) of Hospitals with Zero, One, Two, or Three or More MRSA LabID Events Stratified by Hospital Type among those with Less Than One Predicted Infection | Pennsylvania, 2020| Hospital Type | Number of Hospitals | Zero | One | Two | Three or more |
|---|---|---|---|---|---|
| ACH | 68 | 56 ( 82.4 %) | 10 ( 14.7 %) | 1 ( 1.5 %) | 1 ( 1.5 %) |
| LTAC | 5 | 3 ( 60 %) | 2 ( 40 %) | 0 ( 0 %) | 0 ( 0 %) |
| IRF | 68 | 58 ( 85.3 %) | 9 ( 13.2 %) | 1 ( 1.5 %) | 0 ( 0 %) |
| Total | 141 | 117 ( 83 %) | 21 ( 14.9 %) | 2 ( 1.4 %) | 1 ( 0.7 %) |
4.7.4 MRSA LabID Event Measures by Hospital
Table 24 includes data from 241 hospitals. Fifteen hospitals had a SIR of 0.0. The number of predicted MRSA LabID events ranged between 1.1 and 3 in those facilities. Five hospitals (identified by blue font) had statistically significant SIR values that were less than 1.0, meaning that they reported fewer MRSA events than in the 2015 national baseline. One of these hospitals reported no MRSA LabID events. Two hospitals (identified by red font) had statistically significant SIR values that were more than 1.0.
Table 24: List of Hospitals with MRSA Blood Infection SIRs by Hospital Name | Pennsylvania, 2020
Hospitals printed in red reported statistically significantly more MRSA events than predicted. Hospitals printed in blue reported statistically significantly fewer MRSA events than predicted.