6 Appendix
6.0.1 SSI SIRs (Superficial and Deep Tissue)
As mentioned in the methods chapter of this report, the NHSN protocol sets forth two different methods to evaluate SSIs, which are referred to as “all” and “complex”. Results presented in this section contain metrics using the “all” model, which includes superficial infections, deep tissue and organ space SSIs. For a more detailed description of the all case definition and adjustment models, please refer to the SIR Guide Supplement48. HHS does not set a 2020 reduction goal for this classification of SSIs. However, the Pennsylvania Department did set a 2030 reduction goal for this classification of SSIs.
6.0.2 State SSI SIRs by Type of Surgical Procedure
Table A.1 shows the number of surgeries performed in 2021, number of SSIs, number of predicted infections and respective SIR value for each surgical procedure. Note that the number of predicted SSIs is slightly different than those displayed in Chapter 4, Table 12 but the number of surgeries performed is identical. The state SSI SIR for the seven monitored surgical procedures ranges between 0.68 and 1.1.
The SSI SIR values for HPRO and CARD were close to 1.0 (HPRO SIR: 1.03; CARD SIR: 1.1) and neither were statistically different than the 2015 national baseline. The state-wide SSI SIR values for COLO, KPRO, and HYST, were statistically significantly lower than the 2015 national baseline (COLO SIR: 0.7; 95% CI: (0.64, 0.75), KPRO SIR: 0.78; 95% CI: (0.67, 0.90), HYST SIR: 0.68; 95% CI: (0.57, 0.80)). The SSI SIR values for CBGC and CBGB were 23.1% and 17.8% less than the number of predicted infections but neither SIR was statistically significantly different than 1.0.
Table A.1: SSI SIRs for each of Seven Surgical Procedures | Pennsylvania, 2021
6.0.3 SSI Measures by Type of Hospital
Because nearly all surgical procedures were performed in acute care hospitals, calculation of 2021 SSI SIR values stratified by hospital type is limited. Only CARD, KPRO and COLO were performed in children’s hospitals or CAHs had more than 1.0 predicted SSI. Four surgical procedure-hospital pairs had more than one predicted SSIs and these are presented in Table A.2 below.
None of the SIR values in Table A.2 were statistically significantly different from the 2015 national baseline. One more SSI than was predicted was reported from CAHs among patients that had a KPRO (SIR: 1.78; 95% CI: (0.30, 5.89)). The SIR values from the other surgical-hospital type pairs were less than one. SSIs reported from CAHs that performed COLO were identical to the number predicted, while SSIs reported from children’s hospitals that performed CARD and COLO were one and two fewer than the number predicted by the 2015 national baseline data.
Table A.2: SIRs from Surgical Procedures Commonly Performed in Specific Hospital Types | Pennsylvania, 2021
6.0.4 Distribution of SSI SIR Values by Type of Surgery
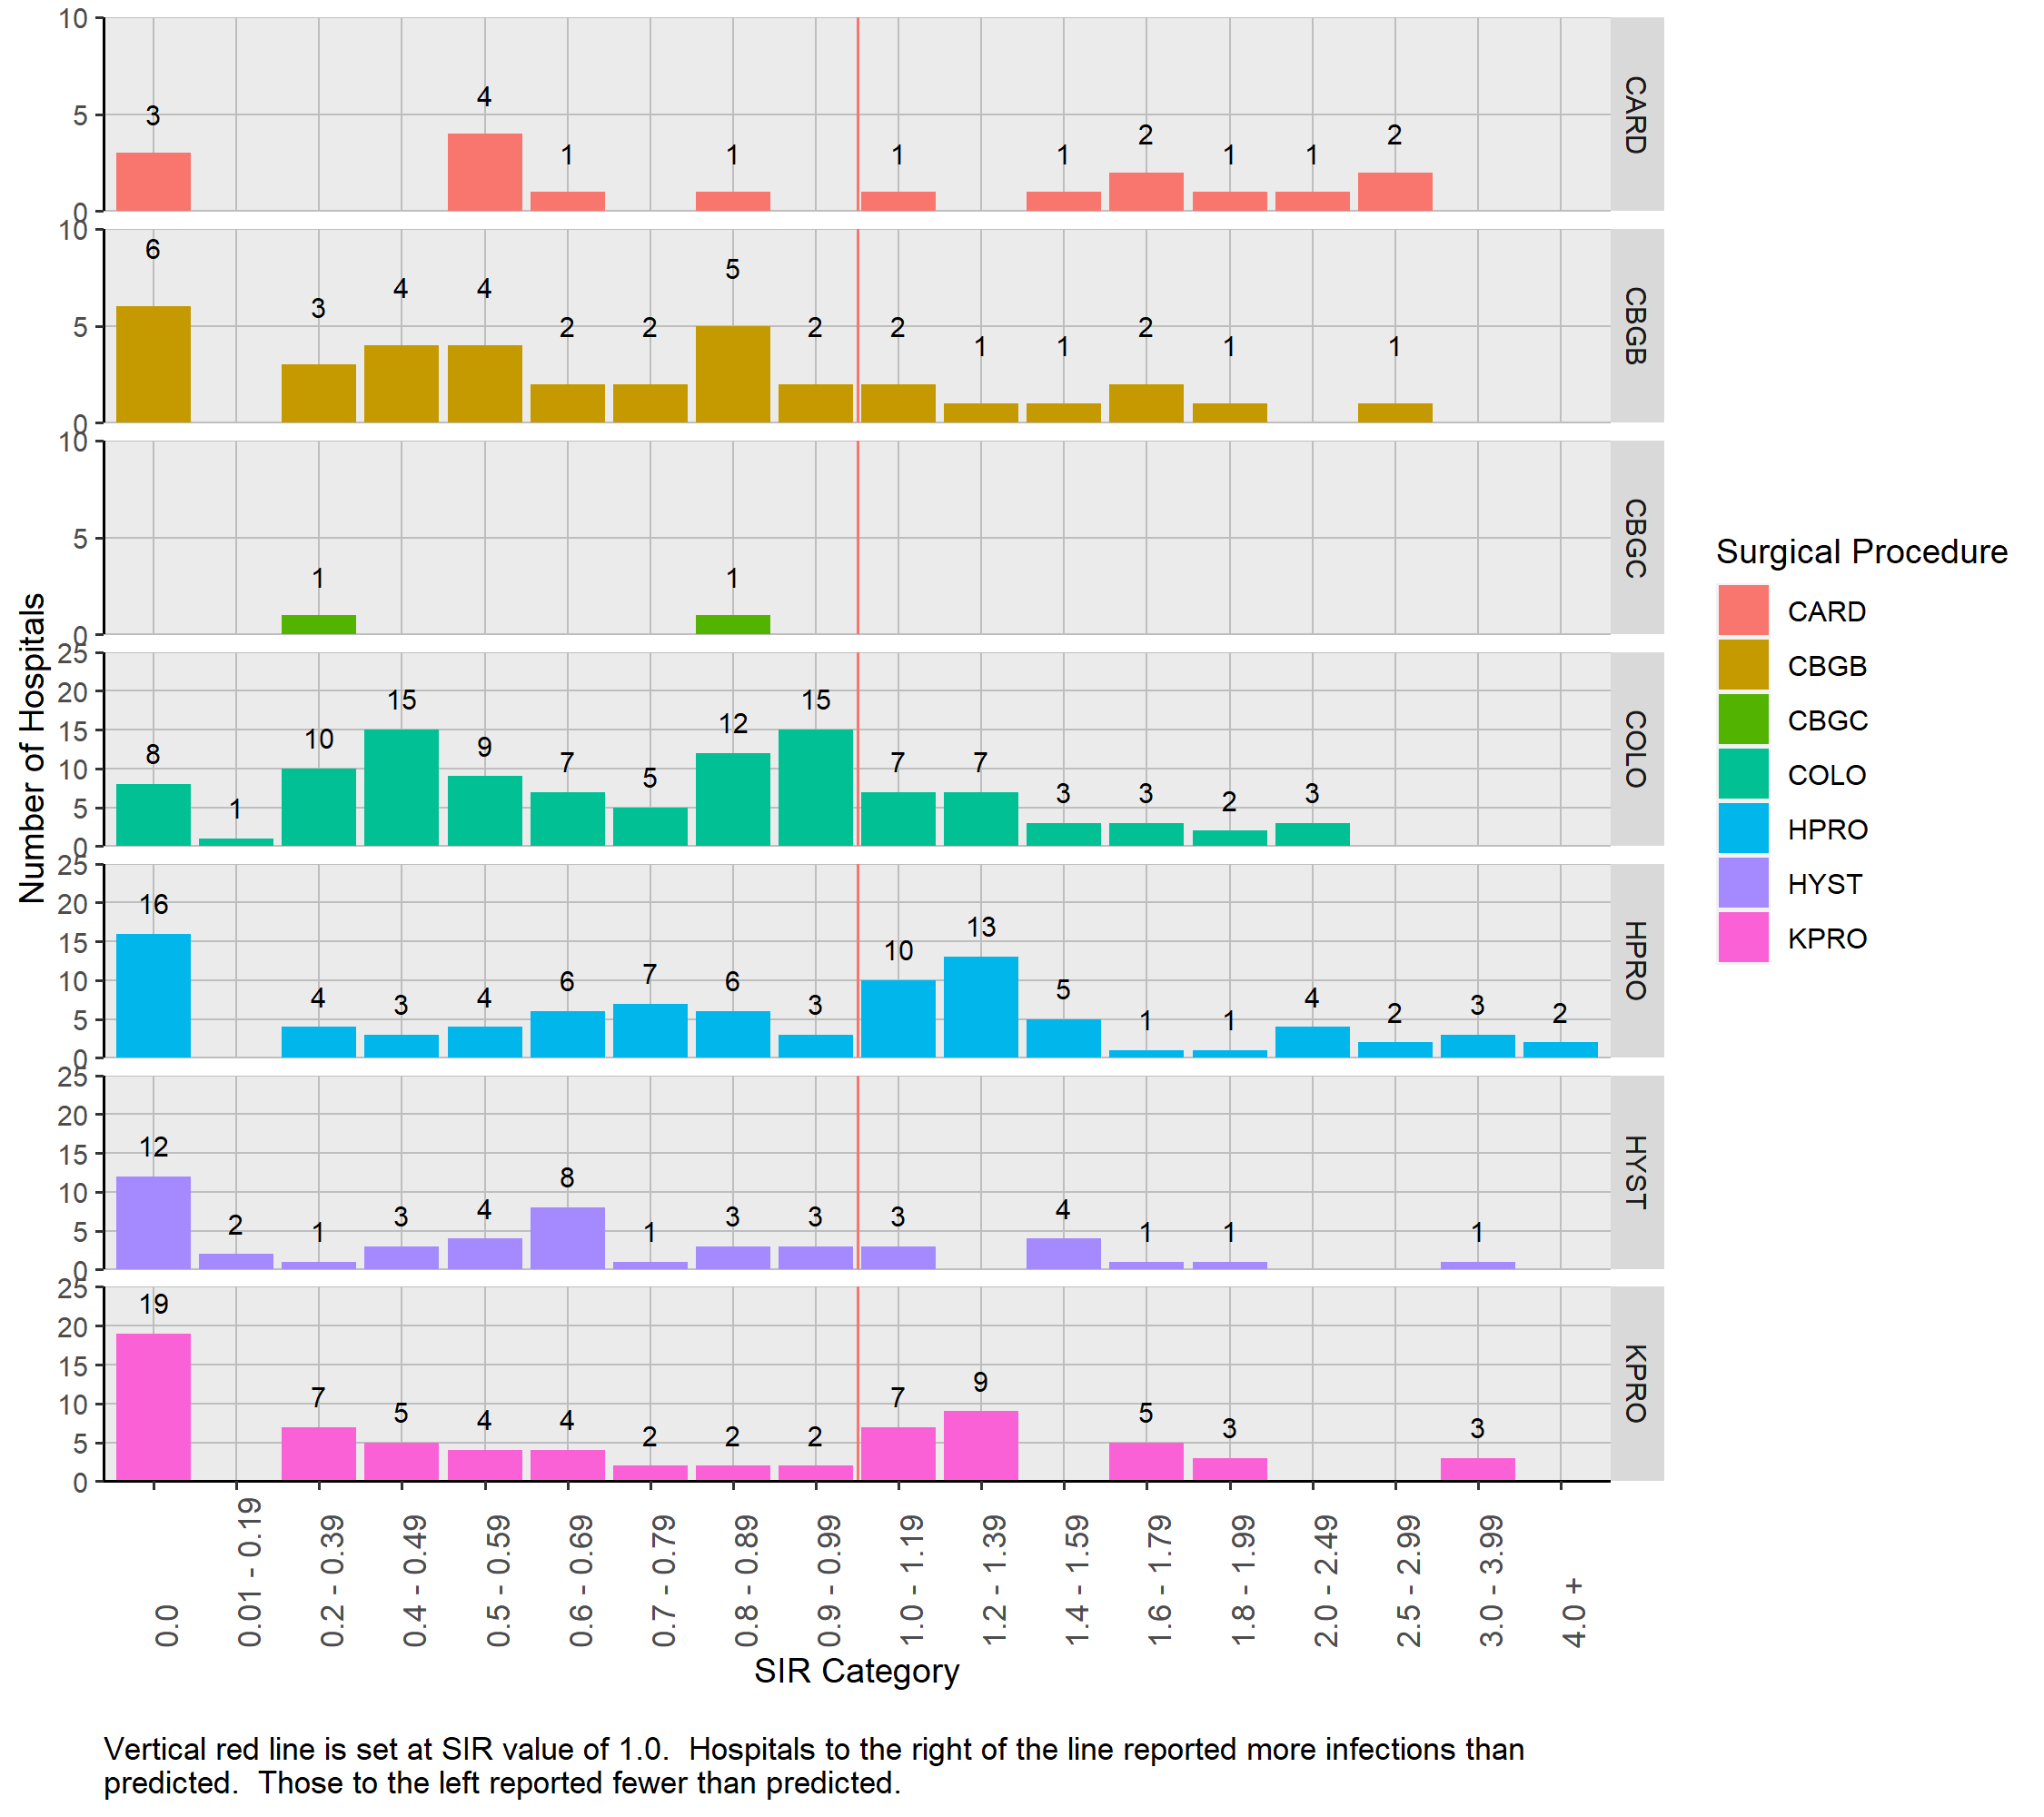
The distribution of 2021 SIR values for the seven surgery types is presented in Figure A.1. The SIR was calculated in those hospitals in which the predicted number of infections was 1.0 or more resulting in the inclusion of 371 hospital-procedure pairs. This includes only four hospital surgery pairs from children’s hospitals. The remaining SIR values are from ACHs. Twenty-two (5.9%) of the SIR values were 2.0 or larger.
Figure A.1: Distribution of SSI SIRs Stratified by Surgical Procedure Type| Pennsylvania, 2021
6.0.5 Statistically Significant SIRs by Surgery Type
Table A.4 shows the number of hospitals with statistically significant SSI SIR values for each type of surgical procedure. It is noteworthy that hospitals that performed colon surgeries had a statistically significant lower SIR value compared with the 2015 national benchmark and none had a statistically significant SIR value more than 1.0. Additionally, seven hospitals that performed hip replacement surgeries had statistically significant SIR values over 1.0.
Table A.4: Number of Hospitals with Statistically Significant SSI SIRs | Pennsylvania 2021
6.0.6 SSI Measures by Hospital
Table A.5 displays the comprehensive list of all hospital-surgical procedure pairs in which one or more of the surgeries was performed during 2021 (N= 729). The SIR was calculated for 371 hospital-surgery pairs (50.9% of 729) when the predicted number of infections was more than 1.0 in 2020.
Table A.5: Hospitals that Perform Seven Types of Surgeries and their SSI SIRs and Associated Measures | Pennsylvania, 2021
Hospitals printed in red have statistically significantly more SSIs than predicted. Hospitals printed in blue have statistically significantly fewer SSIs than predicted.