4 Results
Data in this report come from hospitals including large ACHs, CAHs that have less than 25 beds, LTAC hospitals where patients typically stay more than 10 days and require hospital-level care, and specialty hospitals such as children’s and IPFs. This report also includes data from IRFs that consist of both free-standing buildings (N=19) and CMS designated locations within large acute care hospitals (N=51).
NHSN requires that all hospitals and IRFs complete an annual survey to report general information regarding the previous year. In Pennsylvania, 303 facilities completed a survey in NHSN. Two of the 303 facilities were not open for the entire year and were, therefore, excluded from this report.
Table 1 shows the number of facilities used in the analysis for each type of facility, HAI and metric. Most hospitals that completed the annual NHSN survey reported device days and LabID events. Laboratory-identified events were not routinely reported among children’s hospitals, CAHs, and IPFs because guidance from the Department states that those facilities are not required to report LabID events.
Table 1: Number of Hospitals that Reported Data for Each of the Metrics | Pennsylvania, 2021
| Hospital Type | Hospital Surveys | CAUTI SIR | Urinary Catheter Days | CLABSI SIR | Central Line Days | MRSA Bloodstream Infection SIR | CDI SIR |
|---|---|---|---|---|---|---|---|
| ACH | 160 | 159 | 159 | 159 | 159 | 159 | 159 |
| CAH | 16 | 16 | 16 | 16 | 16 | 0 | 0 |
| Children’s | 5 | 5 | 5 | 5 | 5 | 0 | 0 |
| LTAC | 17 | 17 | 17 | 17 | 17 | 17 | 17 |
| IPF | 33 | 15 | 15 | 11 | 11 | 0 | 0 |
| IRF | 70 | 67 | 67 | 67 | 67 | 67 | 67 |
| Total | 301 | 279 | 279 | 275 | 275 | 243 | 243 |
4.1 CAUTI
4.1.1 CAUTI SIR
In 2021, 1,579 CAUTIs were reported from 279 hospitals. This was 174 fewer CAUTIs than predicted using the 2015 national baseline data (N = 1,753, SIR: 0.9; 95% CI: (0.86, 0.95)) and 275 more CAUTIs than reported in 2020. This SIR was statistically significantly lower than the 2015 national baseline. To reach the 2030 Pennsylvania Department goal of a 50% reduction in CAUTIs from the number that were predicted to occur in 2015, Pennsylvania hospitals needed to prevent an additional 703 infections.
Of the 10 hospitals with the greatest number of predicted infections four had a lower statistically significant SIR than the 2015 national baseline. The SIR values from the six other hospitals were not statistically significantly different from the 2015 national baseline data. Together these six hospitals reported 282 CAUTIs. This is 18% of all CAUTIs in the state and 17% of the number predicted infections in the whole state were predicted to come from these hospitals. It can be interpreted that these hospitals performed the same as hospitals from the 2015 national sample. Cumulatively, these six hospitals had 71 more CAUTIs than in 2020. These six hospitals needed to prevent 133 infections collectively to reach the 2030 Pennsylvania Department SIR goal of 0.50.
4.1.2 CAUTI Measures by Type of Hospital
As displayed in Table 2, the majority of CAUTIs were reported in ACHs (1,396 of 1,579), though this is to be expected. Overall, ACHs performed 11% better when compared to similar hospitals from the 2015 national baseline, with statistically significantly fewer CAUTIs reported than predicted (SIR 0.89; 95% CI: (0.84, 0.94)).
Results vary for other facility types. Critical access hospitals reported more CAUTIs than predicted and IRFs reported more CAUTIs than predicted, though neither of these SIR values are statistically significant. Additionally, children’s hospitals, LTAC hospitals, and IPFs reported one, 16, and two fewer CAUTIs than predicted, respectively, also without statistical significance.
Table 2: Summary of CAUTI Measures Stratified by Hospital Type | Pennsylvania, 2021
4.1.3 Distribution of CAUTI SIR Values by Type of Hospital
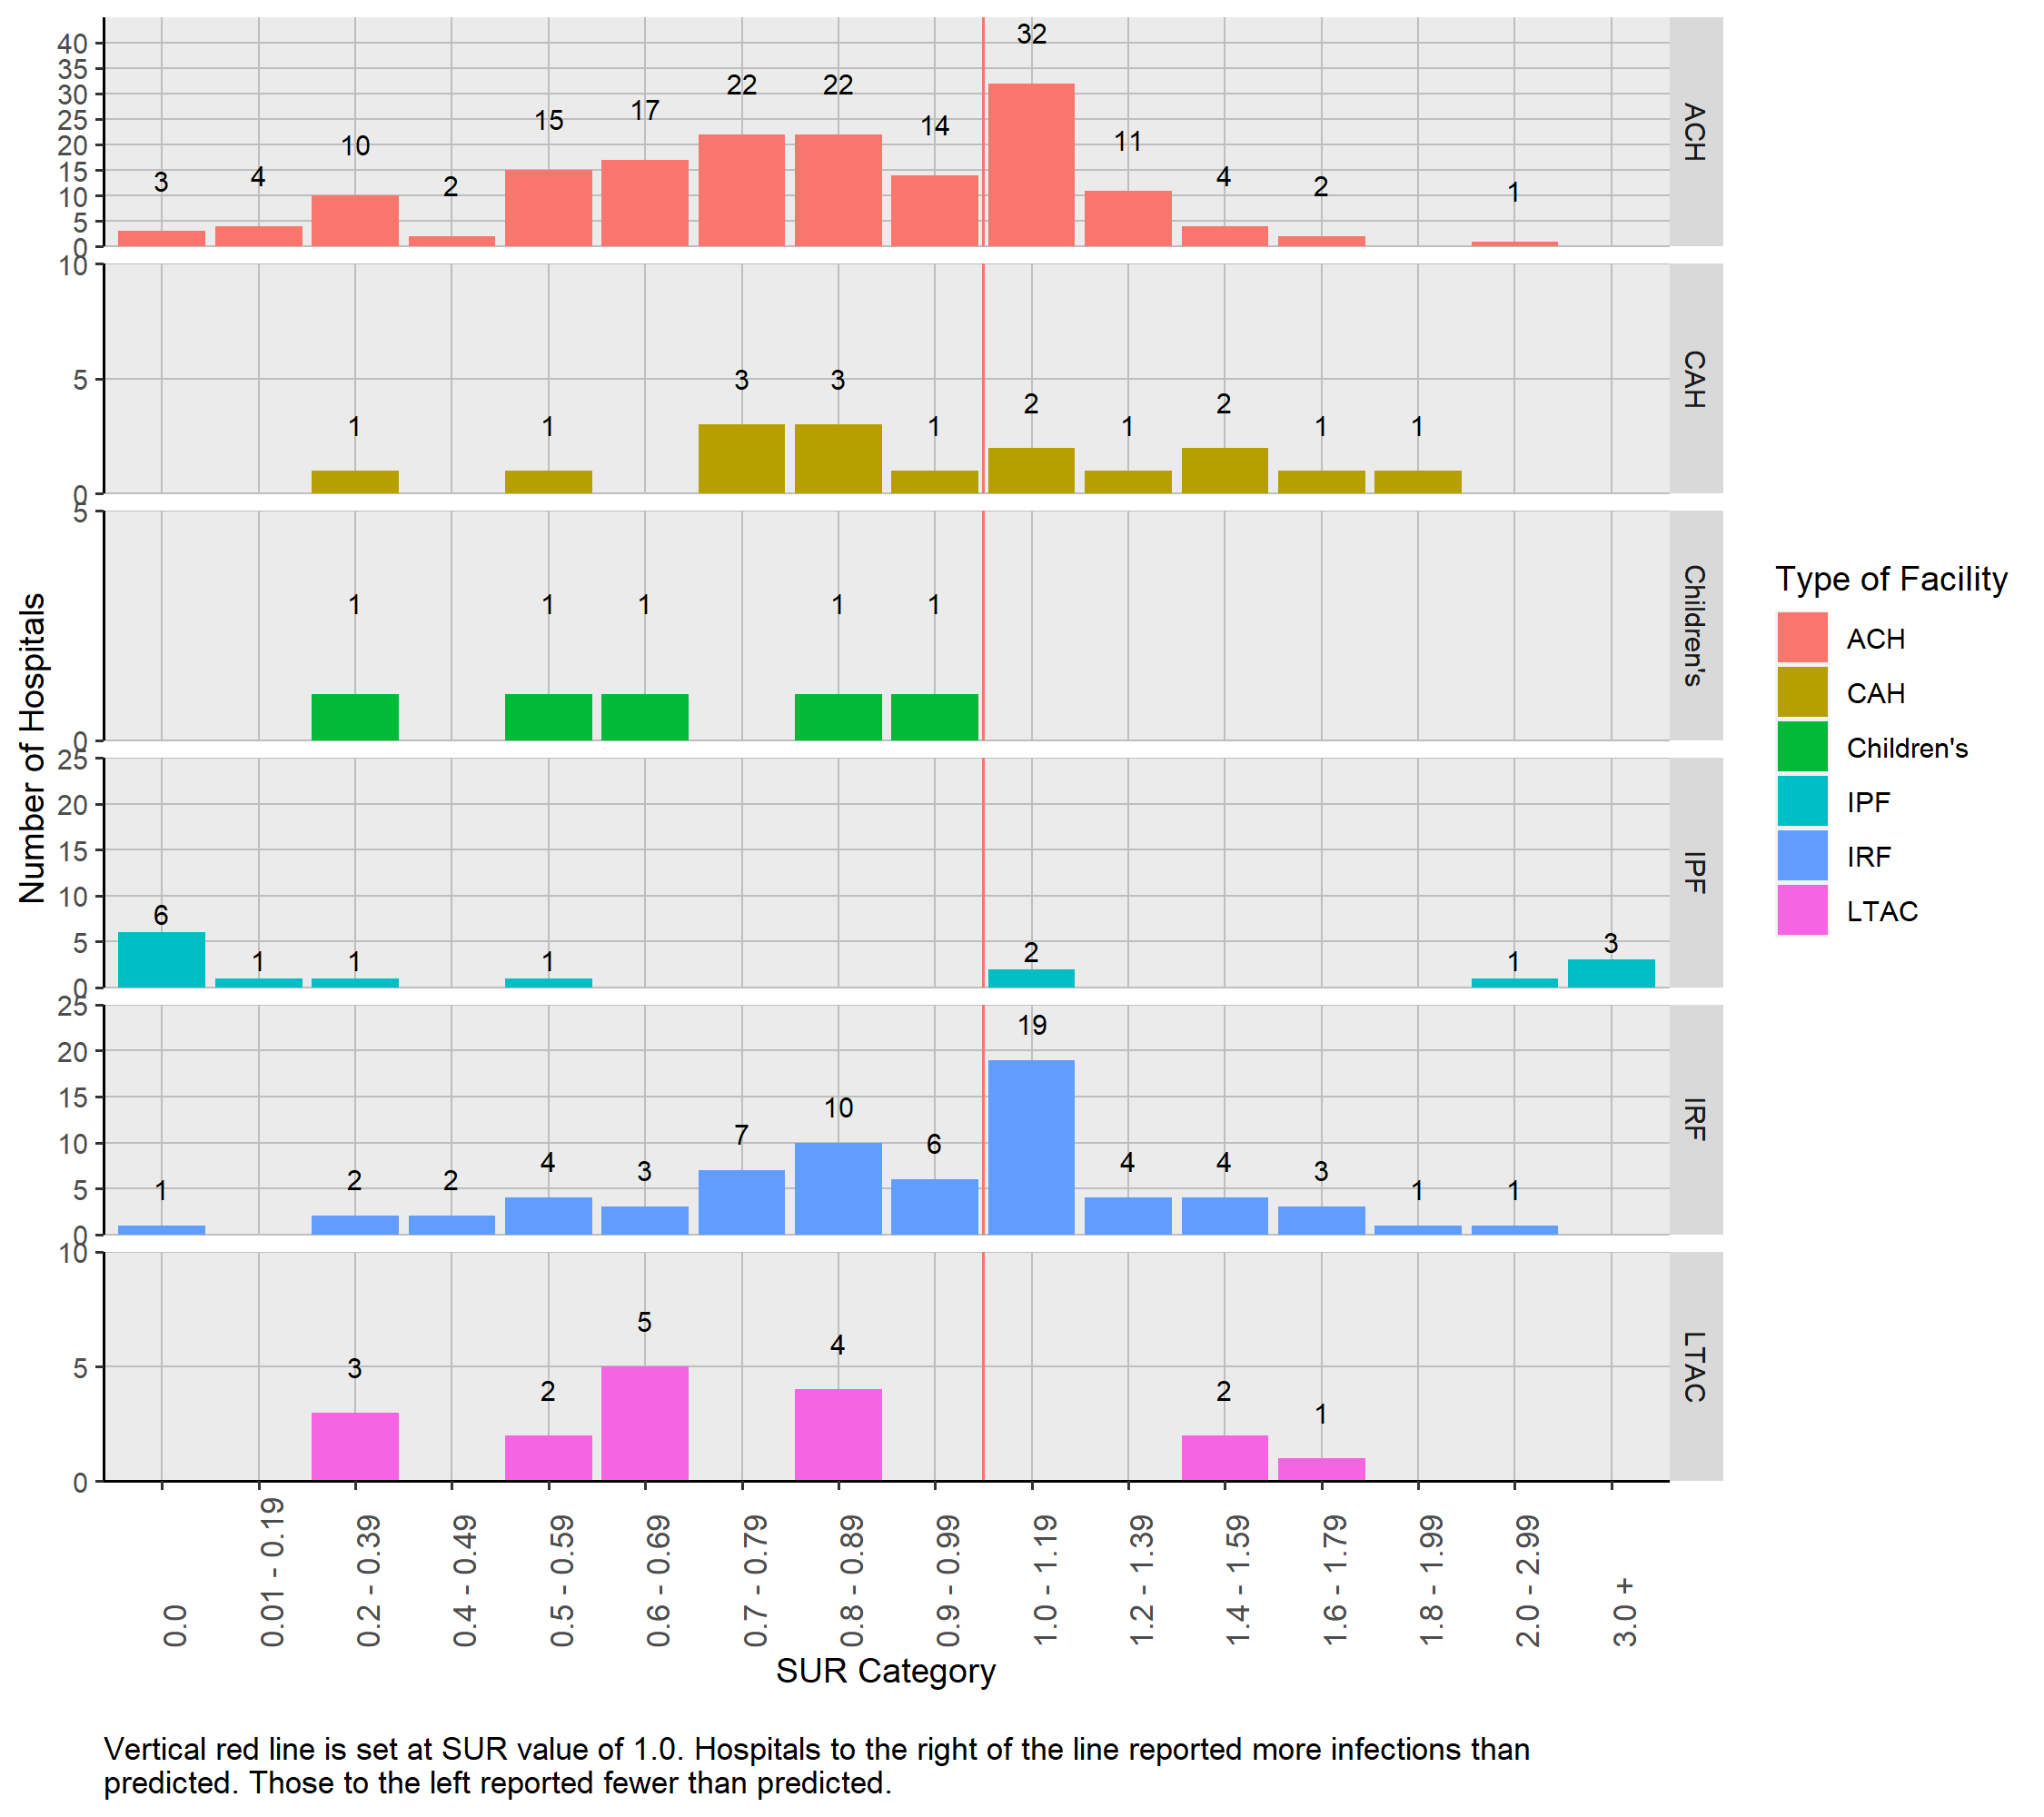
Figure 1 displays the distribution of hospital specific SIR values (N= 167) grouped by hospital type. No IPFs or CAHs had 1.0 or more predicted infection and these facility types are not included in the figure. The hospital specific CAUTI SIR values were dispersed and ranged from 0 to 5.02.
Figure 1: Distribution of CAUTI SIRs by Hospital Type | Pennsylvania, 2021

4.1.4 Number of CAUTIs Among Hospitals With Less Than One Predicted Infection
For facilities that had less than 1.0 predicted CAUTI based on the 2015 national baseline data, a SIR could not be calculated. These facilities as well as the number of reported CAUTIs are listed in Table 3. Although a SIR could not be calculated, these facilities can be evaluated with caution in light of the number of reported CAUTIs. Of the 112 facilities with less than 1.0 predicted CAUTI, 79 reported zero infections. Although less than 1.0 CAUTI was predicted, 20 hospitals reported one infection, 10 hospitals reported two infections and three hospitals reported three or more infections.
Table 3: Number (Percent) of Hospitals with Zero, One, Two, or Three or More CAUTIs Stratified by Hospital Type among those with Less Than One Predicted Infection | Pennsylvania, 2021| Hospital Type | Number of Hospitals | Zero | One | Two | Three or more |
|---|---|---|---|---|---|
| ACH | 43 | 32 ( 74.4 %) | 7 ( 16.3 %) | 4 ( 9.3 %) | 0 ( 0 %) |
| CAH | 16 | 11 ( 68.8 %) | 1 ( 6.2 %) | 3 ( 18.8 %) | 1 ( 6.2 %) |
| Children’s | 3 | 2 ( 66.7 %) | 1 ( 33.3 %) | 0 ( 0 %) | 0 ( 0 %) |
| IPF | 15 | 14 ( 93.3 %) | 1 ( 6.7 %) | 0 ( 0 %) | 0 ( 0 %) |
| IRF | 35 | 20 ( 57.1 %) | 10 ( 28.6 %) | 3 ( 8.6 %) | 2 ( 5.7 %) |
| Total | 112 | 79 ( 70.5 %) | 20 ( 17.9 %) | 10 ( 8.9 %) | 3 ( 2.7 %) |
4.1.5 CAUTI Measures by Hospital
Table 4 lists the 279 hospitals and relevant CAUTI data, as well as the county where the hospital is located. Nineteen hospitals (6.8%) had SIR values of zero, meaning that no CAUTIs were reported and more than one was predicted. The corresponding predicted number of CAUTIs ranged between 1.0 and 6.9 for those hospitals.
Thirteen hospitals (identified by blue font) reported statistically significantly fewer CAUTIs than were predicted in the 2015 national baseline, meaning that their SIR was less than 1.0. Three of these hospitals reported no infections, although the predicted number of infections ranged between 4 and 6.9. Among the remaining 10 hospitals where at least one CAUTI was reported, the range of predicted CAUTIs was between 8.6 and 94. Thirteen other hospitals (identified by red font) reported statistically significantly more CAUTIs than were predicted in the 2015 national baseline, meaning that their SIR was more than 1.0. Seven of these hospitals were predicted to have less than five CAUTIs.
Table 4: List of Hospitals with CAUTI SIRs and Associated Measures | Pennsylvania, 2021 Hospitals printed in red reported statistically significantly more CAUTIs than predicted. Hospitals printed in blue reported statistically significantly fewer CAUTIs than predicted.
4.2 Urinary Catheter SUR
The urinary catheter SUR for Pennsylvania was 0.86 (95% CI: (0.85, 0.86)). This is 14.3% lower than the 2015 national baseline. Urinary catheter days data were reported from 279 facilities. Ten reported no urinary catheter days, 38 hospitals reported between 1 and 200 urinary catheter days, 72 reported between 201 and 1,000 urinary catheter days, 77 reported between 1,001 and 5,000 urinary catheter days, 38 hospitals reported between 5,001 and 10,000 urinary catheter days, and the remaining 44 reported more than 10,000 urinary catheter days.
4.2.0.1 Urinary Catheter Measures by Type of Hospital
Table 5 lists the SUR, reported number, and predicted number of urinary catheter days for different types of hospitals. Inpatient psychiatric facilities reported a SUR value statistically significantly higher than the 2015 national baseline data (SUR: 1.18; 95% CI: (1.13, 1.24)). This means that IPFs in Pennsylvania in 2021 reported 18.2% more urinary catheter use days than predicted. Acute care hospitals, children’s hospitals, LTAC facilities, and IRFs all had statistically significantly lower SUR values. This means they used urinary catheters less often than predicted. Critical access hospitals also had a low SUR value of 0.98, though it was not statistically significant.
Table 5: Summary of Urinary Catheter Utilization Measures by Hospital Type | Pennsylvania, 2021
4.2.1 Distribution of Urinary Catheter SUR Values by Type of Hospital
Figure 2 shows that the hospital-specific urinary catheter SUR values were dispersed and ranged from 0 to 28.32. One hundred eighty-one (64.9%) of the 279 hospitals had SURs less than 1.0. Three IPFs had SUR values more than 3.0 (SUR: 10.0, 10.2 and 28.3), meaning that urinary catheters were used more than three times as often than those of similar hospitals from the 2015 national baseline.
Figure 2: Distribution of Urinary Catheter SURs by Hospital Type | Pennsylvania, 2021
4.2.2 Urinary Catheter Measures by Hospital
Table 6 shows the reported and predicted number of urinary catheter days, SUR values and 95% CIs for each hospital. The number of predicted urinary catheter days in hospitals ranged from 2 to 55,713, and the reported use ranged from 0 to 55,629. Examination of the hospitals with the highest 10 SUR values shows that nine had less than 2,000 predicted urinary catheter days.
Table 6: List of Hospitals with Urinary Catheter SURs by Hospital Name | Pennsylvania, 2021
Hospitals printed in red reported statistically significantly more urinary catheter days than predicted. Hospitals printed in blue reported statistically significantly fewer urinary catheter days than predicted.
4.3 CLABSI
4.3.1 CLABSI SIR
In 2021, 1,401 CLABSIs were reported from 275 hospitals. Statistically, the state SIR value is significantly lower than the 2015 national baseline (SIR: 0.9; 95% CI: (0.85, 0.94)). The number of reported CLABSIs in 2021 was 160 fewer CLABSIs than predicted using the 2015 national baseline data and 188 more than were reported in 2020. To reach the 2030 Pennsylvania Department goal of a 50% reduction in CLABSIs, an additional 620 infections needed to be prevented throughout the commonwealth.
Of the 10 hospitals with the greatest number of predicted infections, three had a lower statistically significant SIR than the 2015 national baseline. The SIR values from the seven other hospitals were not statistically significantly different from the 2015 national baseline data. Together these seven hospitals had 438 CLABSIs. This was 31% of all CLABSIs in the state and yet only 30% of the number predicted infections in the state were predicted to come from these hospitals. Cumulatively, these seven hospitals had 56 more CLABSIs than in 2020 and they needed to prevent 205 infections to reach the 2030 Pennsylvania Department goal.
4.3.2 CLABSI Measures by Type of Hospital
As seen in Table 7, most CLABSIs were reported from ACHs (1,177 of 1,401). Acute care hospitals performed 8% better than similar hospitals from the 2015 national baseline with a statistically significantly lower SIR value (SIR: 0.92; 95% CI: (0.87, 0.98)). Long-term acute care hospitals reported 43% fewer CLABSIs than predicted with statistical significance (SIR: 0.57; 95% CI: (0.45, 0.72)).
Children’s hospitals and IRFs also had SIR values below 1.0, as they reported fewer CLABSIs than predicted. However, these values were not statistically significant (Childrens’ SIR: 0.98; 95% CI: (0.82, 1.15); IRF SIR: 0.78; 95% CI: (0.49, 1.18)). Critical access hospitals reported 0 CLABSIs and IPFs were predicted to have less than 1.0 infection.
Table 7: Summary of CLABSI Measures Stratified by Hospital Type | Pennsylvania, 2021
4.3.3 Distribution of CLABSI SIR Values by Type of Hospital
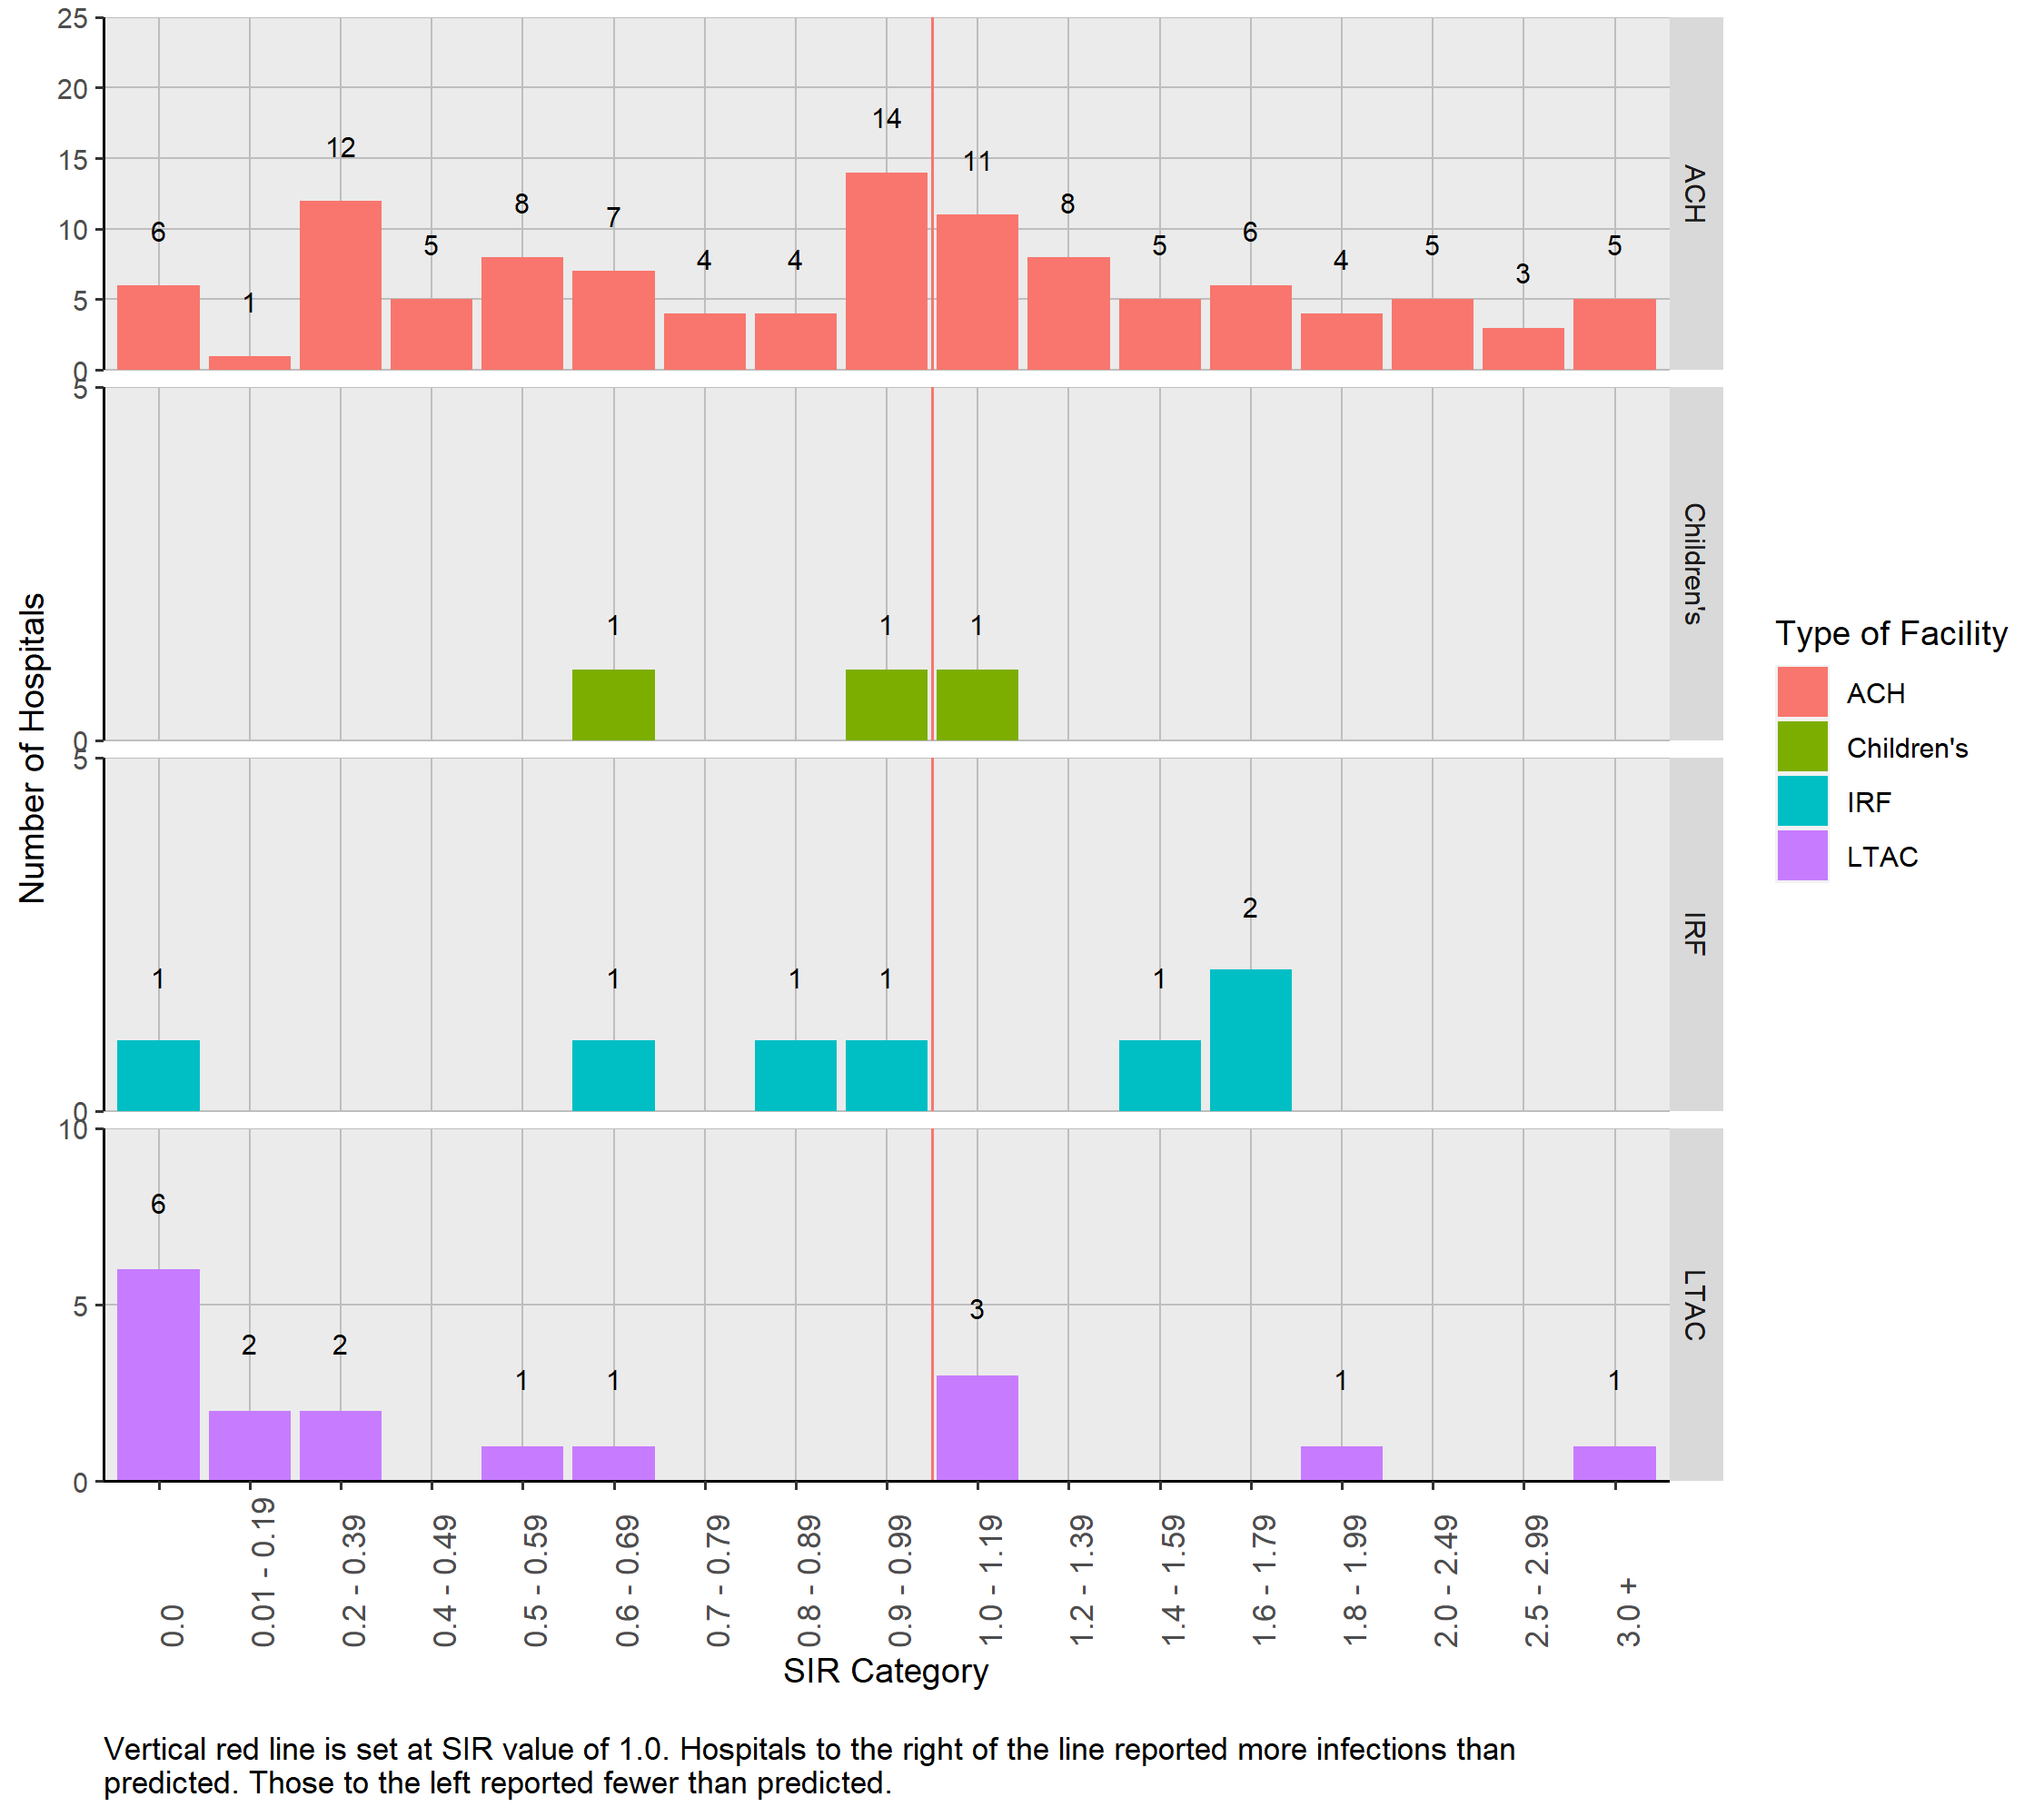
Figure 3 displays the distribution of hospital specific CLABSI SIR values (N=135) grouped by hospital type. Hospital-specific SIR values were not calculated for CAHs and IPFs because the number of predicted CLABSIs was less than 1.0.
Figure 3: Distribution of CLABSI SIRs by Hospital Type | Pennsylvania, 2021
4.3.4 Number of CLABSIs Among Hospitals With Less Than One Predicted Infection
For facilities that had less than 1.0 predicted CLABSI based on the 2015 national baseline data, a SIR could not be calculated. These facilities as well as the number of reported CLABSIs are listed in Table 8. Although a SIR could not be calculated, these facilities can be evaluated with caution in light of the number of reported CLABSIs. Of the 140 facilities with less than 1.0 predicted CLABSI, 126 reported zero infections. Although less than 1.0 CLABSI was predicted, nine hospitals reported one infection, three hospitals reported two infections and two hospitals reported three or more infections.
Table 8: Number (Percent) of Hospitals with Zero, One, Two, or Three or More CLABSIs Stratified by Hospital Type among those with Less Than One Predicted Infection | Pennsylvania, 2021| Hospital Type | Number of Hospitals | Zero | One | Two | Three or more |
|---|---|---|---|---|---|
| ACH | 51 | 46 ( 90.2 %) | 3 ( 5.9 %) | 1 ( 2 %) | 1 ( 2 %) |
| CAH | 16 | 16 ( 100 %) | 0 ( 0 %) | 0 ( 0 %) | 0 ( 0 %) |
| Children’s | 2 | 1 ( 50 %) | 0 ( 0 %) | 1 ( 50 %) | 0 ( 0 %) |
| IPF | 11 | 10 ( 90.9 %) | 1 ( 9.1 %) | 0 ( 0 %) | 0 ( 0 %) |
| IRF | 60 | 53 ( 88.3 %) | 5 ( 8.3 %) | 1 ( 1.7 %) | 1 ( 1.7 %) |
| Total | 140 | 126 ( 90 %) | 9 ( 6.4 %) | 3 ( 2.1 %) | 2 ( 1.4 %) |
4.3.5 CLABSI Measures by Hospital
Table 9 lists CLABSI data and county of hospital from 275 hospitals. Twenty-one hospitals (identified by blue font) reported statistically significantly fewer CLABSIs than were predicted in the 2015 national baseline, meaning that their SIR was less than 1.0. Six of these hospitals reported no infections, although the predicted number of infections ranged between 3 and 8.9. Among the remaining 15 hospitals where at least one CLABSI was reported, the range of predicted CLABSIs was between 6.1 and 68.1. Fourteen hospitals (identified by red font) reported statistically significantly more CLABSIs than were predicted in the 2015 national baseline, meaning that their SIR was more than 1.0. Seven of these hospitals were predicted to have less than five CLABSIs.
Table 9: List of Hospitals with CLABSI SIRs and Associated Measures | Pennsylvania, 2021
Hospitals printed in red reported statistically significantly more CLABSIs than predicted. Hospitals printed in blue reported statistically significantly fewer CLABSIs than predicted.
4.4 Central Line SUR
The central line SUR was calculated for all the facilities that reported data. The state SUR was 0.83 (95% CI: (0.83, 0.83)) which is 17.2% less use than predicted by the 2015 national baseline. In 2020 the SUR was 0.83 (95% CI: (0.83, 0.83)). Seventeen hospitals reported no central line days, 48 hospitals reported between 1 and 200 central line days, 59 reported between 201 and 1,000 central line days, 86 reported between 1,001 and 5,000 central line days, 30 hospitals reported between 5,001 and 10,000 central line days, and the remaining 35 reported more than 10,000 central line days.
4.4.1 Central Line Use Measures by Type of Hospital
Table 10 shows the SUR values, as well as predicted and reported central line days stratified by hospital type. Acute care hospitals reported most of the central lines in Pennsylvania hospitals in 2021 (N=1,246,198). They were predicted to have 1,488,628 central line days and they reported 16% fewer central line days than predicted. They had a SUR value statistically significantly lower than 1.0 (SUR: 0.84; 95% CI: (0.84, 0.84)).
Children’s hospitals, LTAC hospitals and IRFs also reported fewer central line days than predicted, resulting in SUR values that are statistically significantly lower than 1.0. They performed better than similar hospitals from the 2015 national baseline. Inpatient psychiatric hospitals reported using more central lines than predicted and had a statistically significantly higher number of central line days compared to other similar hospitals from the 2015 national baseline (SUR: 1.2; 95% CI: (1.12, 1.27)). Critical access hospitals in Pennsylvania performed as well as predicted and had a SUR value that is not statistically significantly different from hospitals in 2015 national baseline (SUR: 1.01; 95% CI: (0.98, 1.04)).
Table 10: Summary of Central line SURs by Hospital Type | Pennsylvania, 2021
4.4.2 Distribution of Central Line SUR Values by Type of Hospital
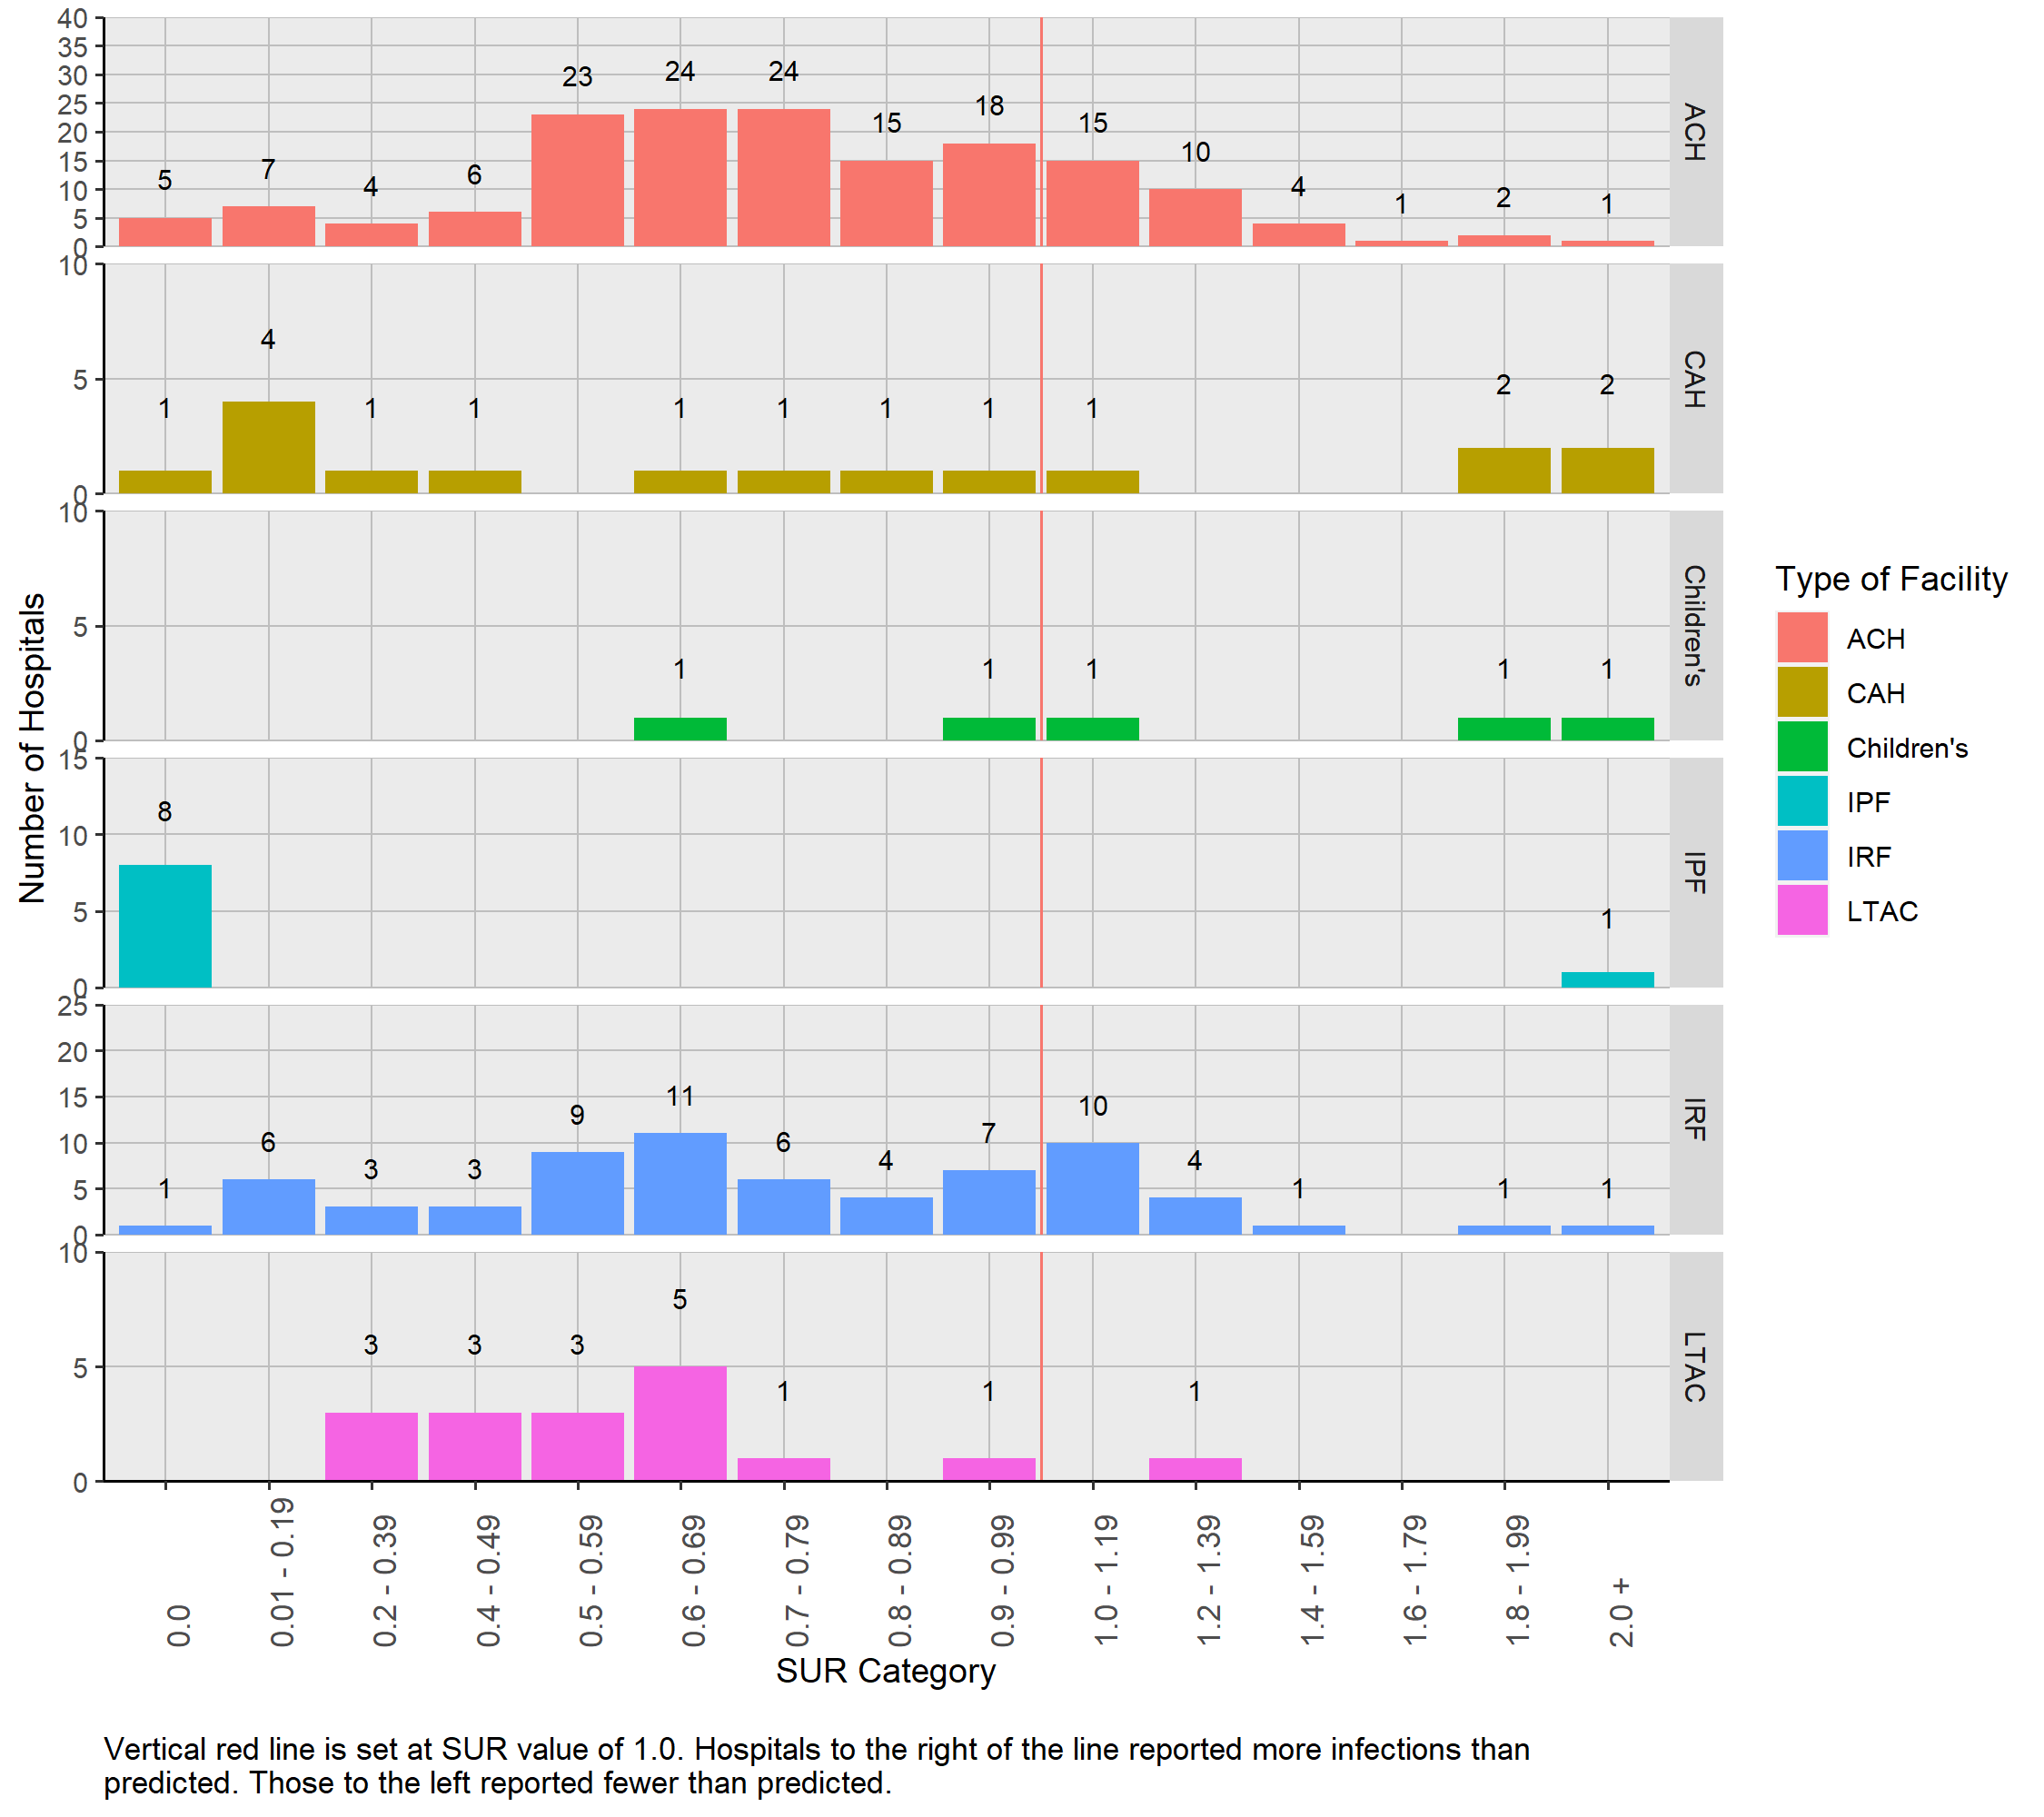
Figure 4 shows that the hospital-specific central line SUR values were dispersed and ranged from 0 to 17.2. One hundred ninety-six (71.8%) of the 273 hospitals with more than 1 predicted central line day had a SUR value less than 1.0. Six hospitals had SUR values more than 2.0 and three of those facilities reported a total of five CLABSIs.
Figure 4: Distribution of Central Line SURs by Hospital Type | Pennsylvania, 2021
4.4.3 Central Line Measures by Hospital
Table 11 shows that the number of predicted central line days in hospitals ranged from 0 to 76,180, and the reported central line days ranged from 0 to 82,297. Examination of the hospitals with the highest 10 SURs shows that all had less than 2,000 predicted central line days.
Table 11: List of Hospitals with Central Line SURs by Hospital Name | Pennsylvania, 2021
Hospitals printed in red reported statistically significantly more central line days than predicted. Hospitals printed in blue reported statistically significantly fewer central line days than predicted.
4.5 SSIs
4.5.1 Description of Surgical Procedures
This 2021 report includes HAIs that were reported following seven surgical procedure types: hip and knee replacement, abdominal hysterectomy, colon surgery and three types of cardiac surgery. After applying the exclusion criteria, a total of 103,860 surgical procedures were performed in 163 hospitals. As a reminder, patients who had surgical procedures but did not spend the night in the hospital were excluded because this type of procedure was classified as an outpatient procedure, not an inpatient procedure.
Table 12 shows that 47 hospitals performed all seven surgeries. Table 13 shows the number of surgeries that were performed at each hospital for each surgical procedure type in 2021.
Table 12: Distribution of Surgeries Performed at Hospitals | Pennsylvania, 2021
| Number of Hospitals | Knee Replacement | Hip Replacement | Abdominal Hysterectomy | Colon | Cardiac Surgery | CBG with 1 incision | CBG with 2 incisions |
|---|---|---|---|---|---|---|---|
| 52 | X | X | X | X | |||
| 47 | X | X | X | X | X | X | X |
| 15 | X | X | X | ||||
| 9 | X | X | X | X | X | ||
| 8 | X | X | |||||
| 6 | X | X | X | ||||
| 4 | X | ||||||
| 3 | X | ||||||
| 3 | X | X | X | X | X | X | |
| 2 | X | X | |||||
| 2 | X | ||||||
| 2 | X | ||||||
| 2 | X | X | X | X | X | X | |
| 1 | X | X | |||||
| 1 | X | X | X | ||||
| 1 | X | X | X | ||||
| 1 | X | X | |||||
| 1 | X | X | X | ||||
| 1 | X | X | |||||
| 1 | X | X | X | ||||
| 1 | X | X | X | X | X |
Table 13: Number of Surgeries Performed at each Hospital | Pennsylvania, 2021
4.5.2 SIRs
Results presented in this section contain metrics using the “complex” model, which includes only deep tissue and organ space SSIs. SSI results that use the “all” model are presented in Appendix A. Superficial infections are not counted as cases in the “complex” model. For a more detailed description of the complex model, please refer to the SIR Guide Supplement48.
4.5.3 State SSI SIRs
Table 14 shows the number of surgeries performed in 2021, number of SSIs, number of predicted infections and respective SIR values for each surgical procedure. Knee replacement surgeries were the most commonly performed surgeries reported in NHSN with 35,927 performed during 2021. Coronary artery bypass grafting with two incisions and CBGC were only performed in ACHs. The SSI SIR values for the seven monitored surgical procedures ranged between 0.37 and 1.26. The state-wide SSI SIR values for COLO surgeries and KPRO were statistically significantly lower than the 2015 national baseline (COLO SIR: 0.84; 95% CI: (0.76, 0.93), KPRO SIR: 0.81; 95% CI: (0.67, 0.98)).
The number of SSIs reported from patients who had HYST and CBGC procedures were, respectively, 19% and 63% less than the number predicted by the 2015 national baseline (HYST SIR: 0.81, CBGC SIR: 0.37), but not statistically different than the 2015 national baseline. The number of SSIs reported from patients who had HPRO, CBGB and CARD are the same or more than the number predicted by the 2015 national baseline.
To reach the 2030 HHS goal of a 30% reduction (SIR = 0.70) in COLO SSIs and HYST SSIs, an additional 62 COLO SSIs need to be prevented and an additional 8 HYST SSIs need to be prevented.
Table 14: SSI Measures for Each of the Seven Surgical Procedures | Pennsylvania, 2021
4.5.4 SSI Measures by Type of Hospital
Because nearly all surgical procedures were performed in ACHs, calculation of the 2021 SSI SIR values stratified by hospital type is limited. Only CARD and COLO surgeries performed in children’s hospitals or CAHs had more than 1.0 predicted SSI. These are presented in Table 15. None of the surgery-hospital type pairs had a statistically significant SIR value that differed from the 2015 national baseline. All pairs reported nearly the same number of SSIs as predicted.
Table 15: SIRs from Surgical Procedure Commonly Performed in Specific Hospital Types | Pennsylvania, 2021
4.5.5 Distribution of SSI SIR Values by Type of Surgery
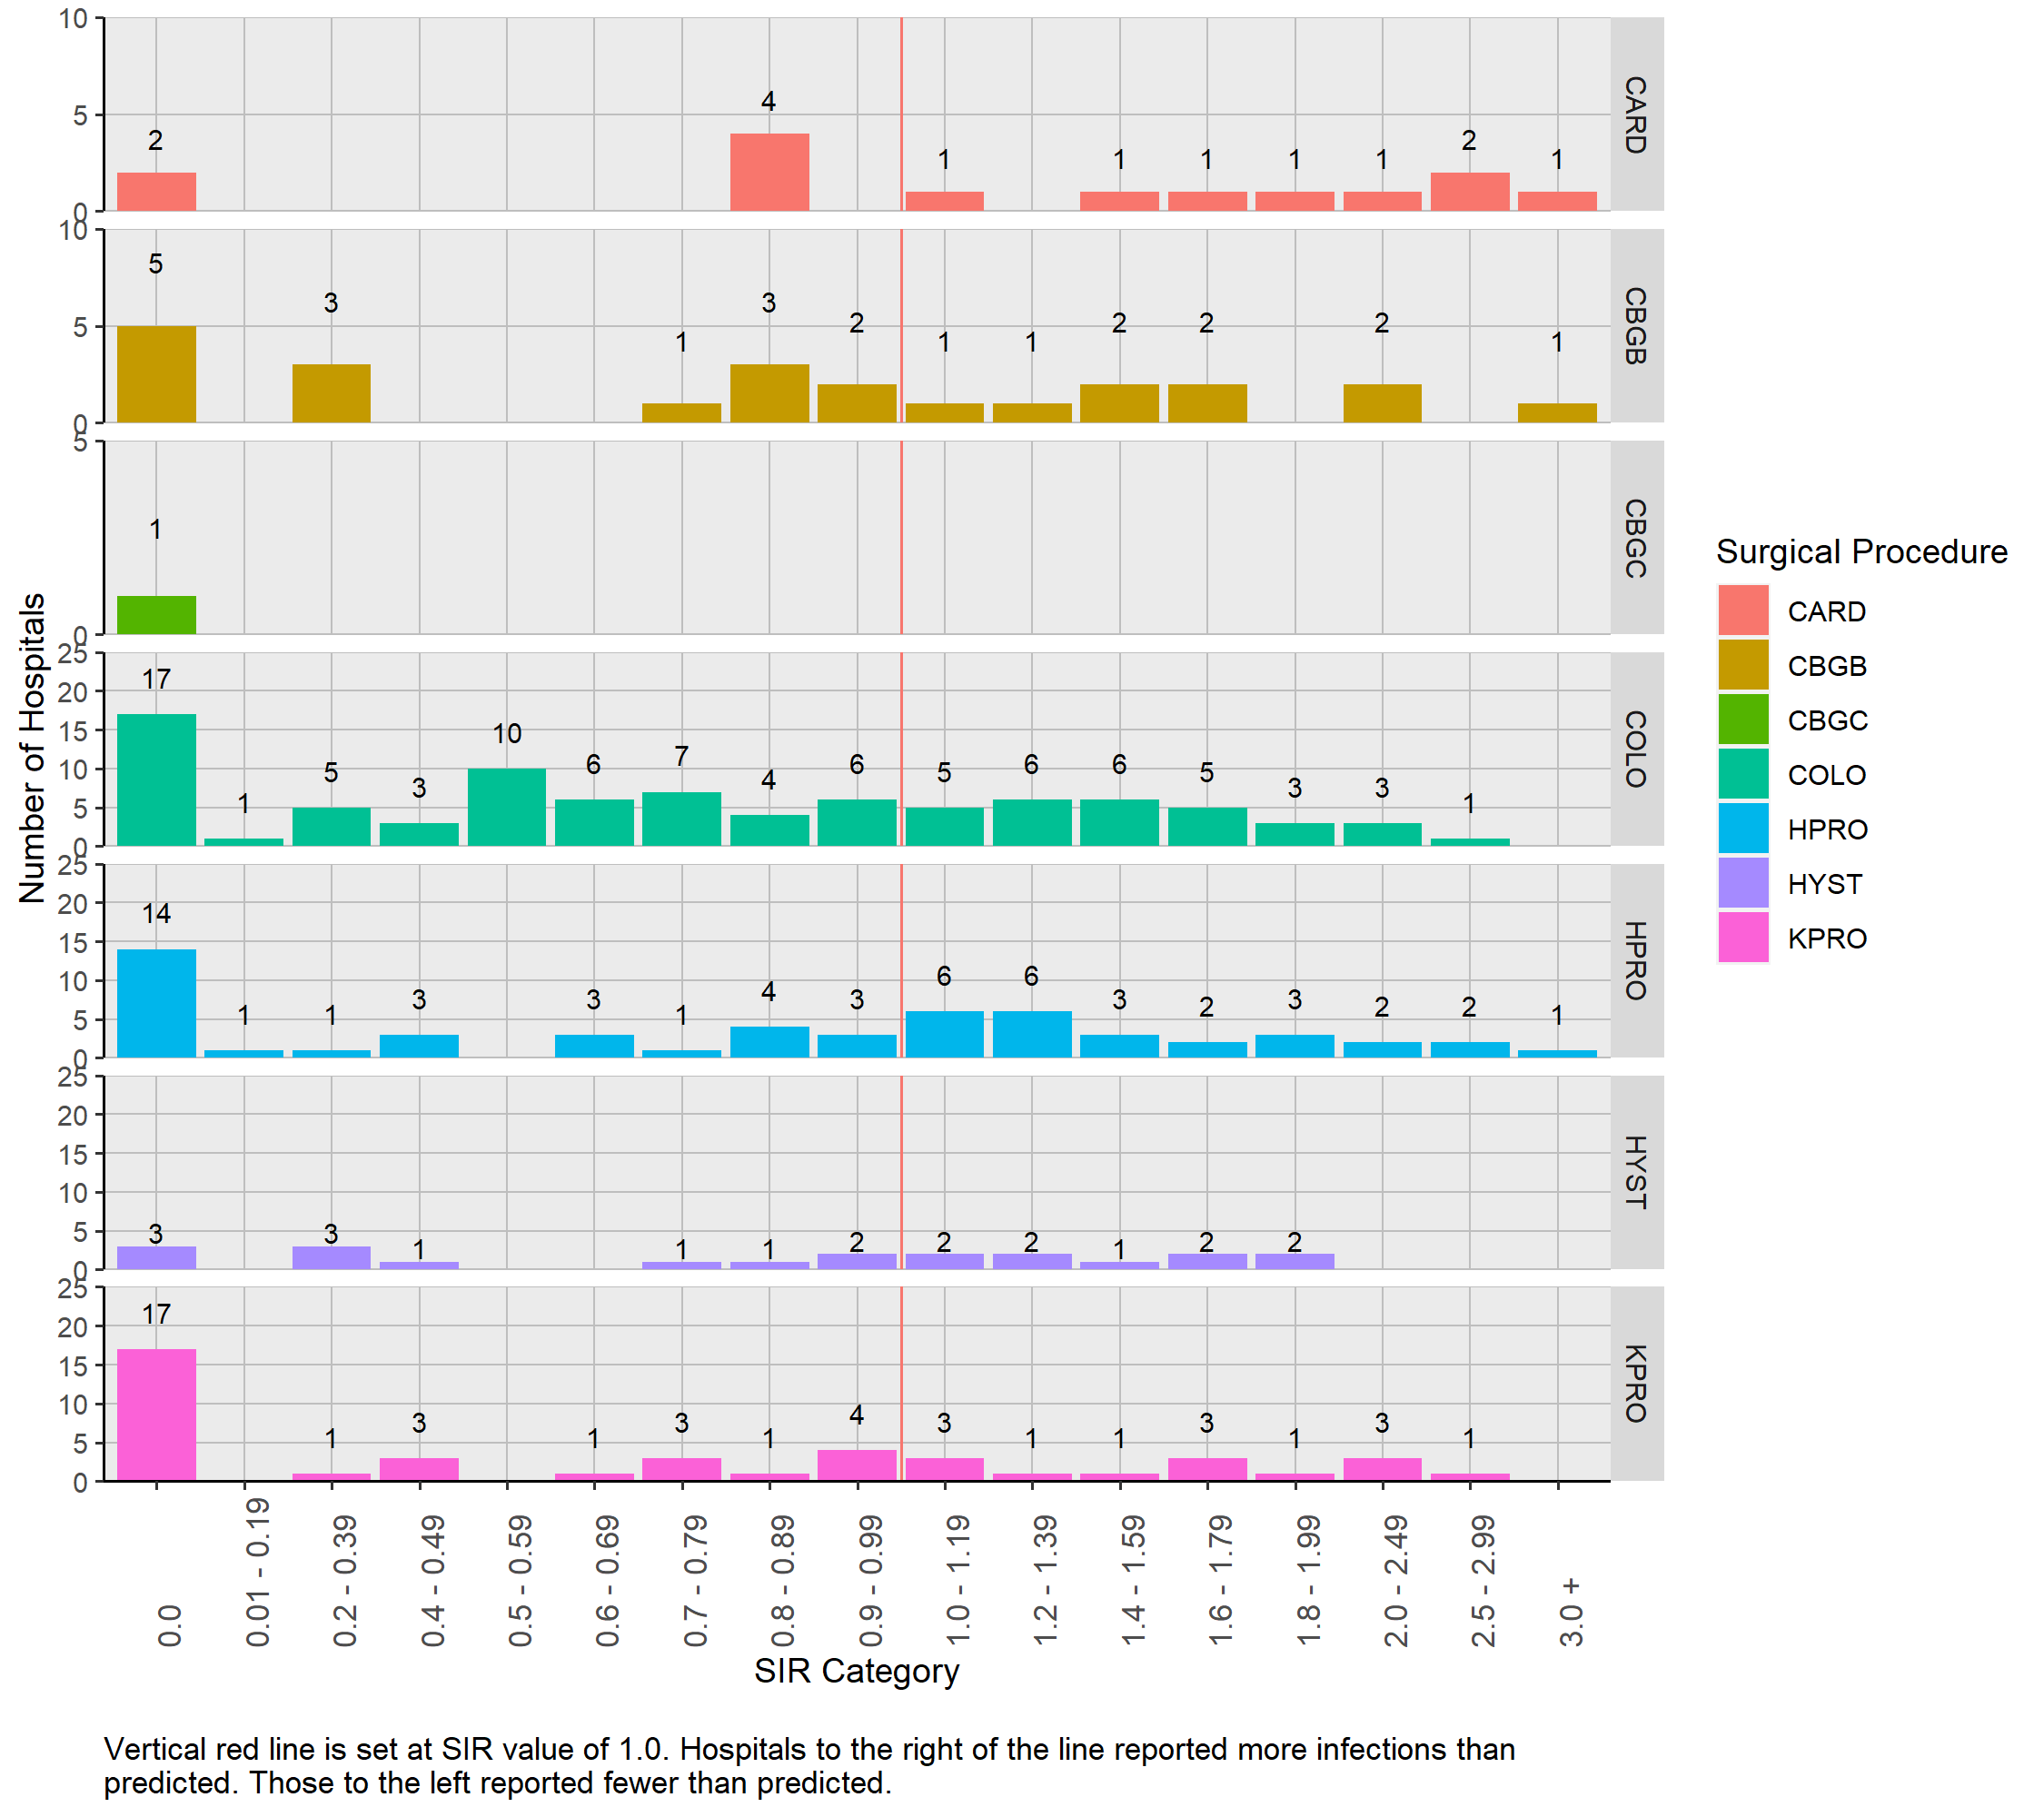
The distribution of 2021 SIR values for the seven surgery types is presented in Figure 5. Because the SIR was only calculated in those hospitals in which the predicted number of infections was 1.0 or more, 244 (32% of all) hospital-procedure pairs are included. This includes only three hospital surgery pairs from children’s hospitals. The remaining SIR values are from ACHs. Twenty (8.2%) of the SIR values were 2.0 or larger.
Figure 5: Distribution of SIRs Stratified by Surgical Procedure Type| Pennsylvania, 2021
4.5.6 Number of SSIs Among Hospitals With Less Than One Predicted Infection by Type of Surgery
For facilities that had less than 1.0 predicted SSI based on the 2015 national baseline data, a SIR could not be calculated.These facilities as well as the number of reported SSIs are listed in Table 16. Although a SIR could not be calculated, these facilities can be evaluated with caution in light of the number of reported SSIs. The majority of hospitals that had less than one predicted SSI reported zero or one infection. Coronary artery bypass grafting with two incisions and HPROs had higher percentages of two or more SSI reported when less than 1.0 was predicted, compared with the other procedures.
The table includes 28 hospital-procedure pairs from CAHs and six pairs from children’s hospitals. Only one of these hospitals reported SSIs.
Table 16: Number (Percent) of Hospitals with Zero, One, Two, or Three or More SSIs Stratified by Surgical Procedure Type Among those with Less Than One Predicted Infection | Pennsylvania, 2021| Surgical Procedure | Number of Hospitals | Zero | One | Two | Three or more |
|---|---|---|---|---|---|
| CARD | 54 | 45 ( 83.3 %) | 5 ( 9.3 %) | 3 ( 5.6 %) | 1 ( 1.9 %) |
| CBGB | 31 | 20 ( 64.5 %) | 6 ( 19.4 %) | 5 ( 16.1 %) | 0 ( 0 %) |
| CBGC | 53 | 45 ( 84.9 %) | 7 ( 13.2 %) | 1 ( 1.9 %) | 0 ( 0 %) |
| COLO | 58 | 46 ( 79.3 %) | 8 ( 13.8 %) | 3 ( 5.2 %) | 1 ( 1.7 %) |
| HPRO | 100 | 74 ( 74 %) | 16 ( 16 %) | 9 ( 9 %) | 1 ( 1 %) |
| HYST | 111 | 92 ( 82.9 %) | 19 ( 17.1 %) | 0 ( 0 %) | 0 ( 0 %) |
| KPRO | 112 | 85 ( 75.9 %) | 19 ( 17 %) | 6 ( 5.4 %) | 2 ( 1.8 %) |
| Total | 519 | 407 ( 78.4 %) | 80 ( 15.4 %) | 27 ( 5.2 %) | 5 ( 1 %) |
4.5.7 Statistically Significant SSI SIRs by Type of Surgery
Table 17 shows the number of hospitals with statistically significant SIR SSI values. Of the five surgical procedures shown in the table, three procedures had more SIR values that are statistically significantly greater than 1.0 than statistically significantly less than 1.0. Among hospitals that performed colon surgical procedures, seven hospitals have a statistically significant SIR value less than 1.0 and two hospitals have a statistically significant SIR value more than 1.0.
Table 17: Number of Hospitals with Statistically Significant SSI SIRs | Pennsylvania, 2021
4.5.8 SSI Measures by Hospital
Table 18 displays the comprehensive list of all hospital-surgical procedure pairs in which one or more of the surgeries was performed during 2021 (N= 729).
Table 18: Hospitals that Perform Seven Types of Surgeries and their SSI SIRs and Associated Measures | Pennsylvania, 2021
Hospitals printed in red reported statistically significantly more SSIs than predicted. Hospitals printed in blue reported statistically significantly fewer SSIs than predicted.
4.6 C. difficile Infections
C. difficile infection LabID events are the most common type of HAI reported in this report. All patients admitted to a hospital are at risk to get a CDI and each day in the hospital increases the chance of getting a CDI30. In 2021, 2,440 CDI events occurred, and 4,288 were predicted from the 2015 national baseline. This is 2.1% (N = 52) fewer than were reported in 2020. The state CDI SIR is 0.57 (95% CI: (0.55, 0.59)), which means that the number of CDI cases is 43.1% lower than the number predicted by the 2015 national baseline. Collectively, the state reached the 2030 HHS goal of attaining a 30% reduction (SIR = 0.70) in CDI events.
Of the 10 hospitals with the greatest number of predicted infections eight had a lower statistically significant SIR than the 2015 national baseline. The SIR values from two other hospitals were not statistically significantly different from the 2015 national baseline data. Together these two hospitals had 170 CDIs. This is 7% of all CDIs in the state and yet only 4% of the number predicted infections in the state are predicted to come from these hospitals. Cumulatively, these two hospitals had 35 more CDIs than in 2020 and needed to prevent 39 infections to reach the 2030 HHS goal.
4.6.1 CDI LabID Event Measures by Type of Hospital
Table 19 illustrates the SIR values, as well as predicted and reported number of CDI LabID events stratified by facility type. These data are based on the number of patient days. Larger facilities with more patients will have more patient days than smaller facilities and are predicted to have more CDI LabID events. Therefore, a higher number of patient days correlates to a higher number of predicted CDI LabID events.
Departmental guidance states that children’s hospitals, CAHs and IPFs are not required to report LabID events. Because of this rule, data reported here do not reflect CDI LabID events from those facility types.
As with many other NSHN HAI metrics, ACHs reported the highest number of CDI LabID events, yet they performed better than predicted using 2015 national baseline data. Acute care hospitals were predicted to have 3,870 CDI LabID events, but only 2,221 CDI LabID events were reported. They have a SIR value that is statistically significantly below 1.0 (SIR: 0.57; 95% CI: (0.55, 0.60)), performing 43% better than other similar hospitals from the 2015 national baseline.
Long-term acute care hospitals and IRFs also reported statistically significantly fewer CDI LabID events than predicted. Long-term acute care facilities performed 60% better (SIR: 0.4; 95% CI: (0.31, 0.51)) and IRFs performed 41% better (SIR: 0.59; 95% CI: (0.51, 0.69)) than predicted using data from similar hospitals in the 2015 national baseline.
Table 19: C. difficile Infection Event SIRs by Hospital Type | Pennsylvania, 2021
4.6.2 Distribution of CDI LabID Event SIR Values by Type of Hospital
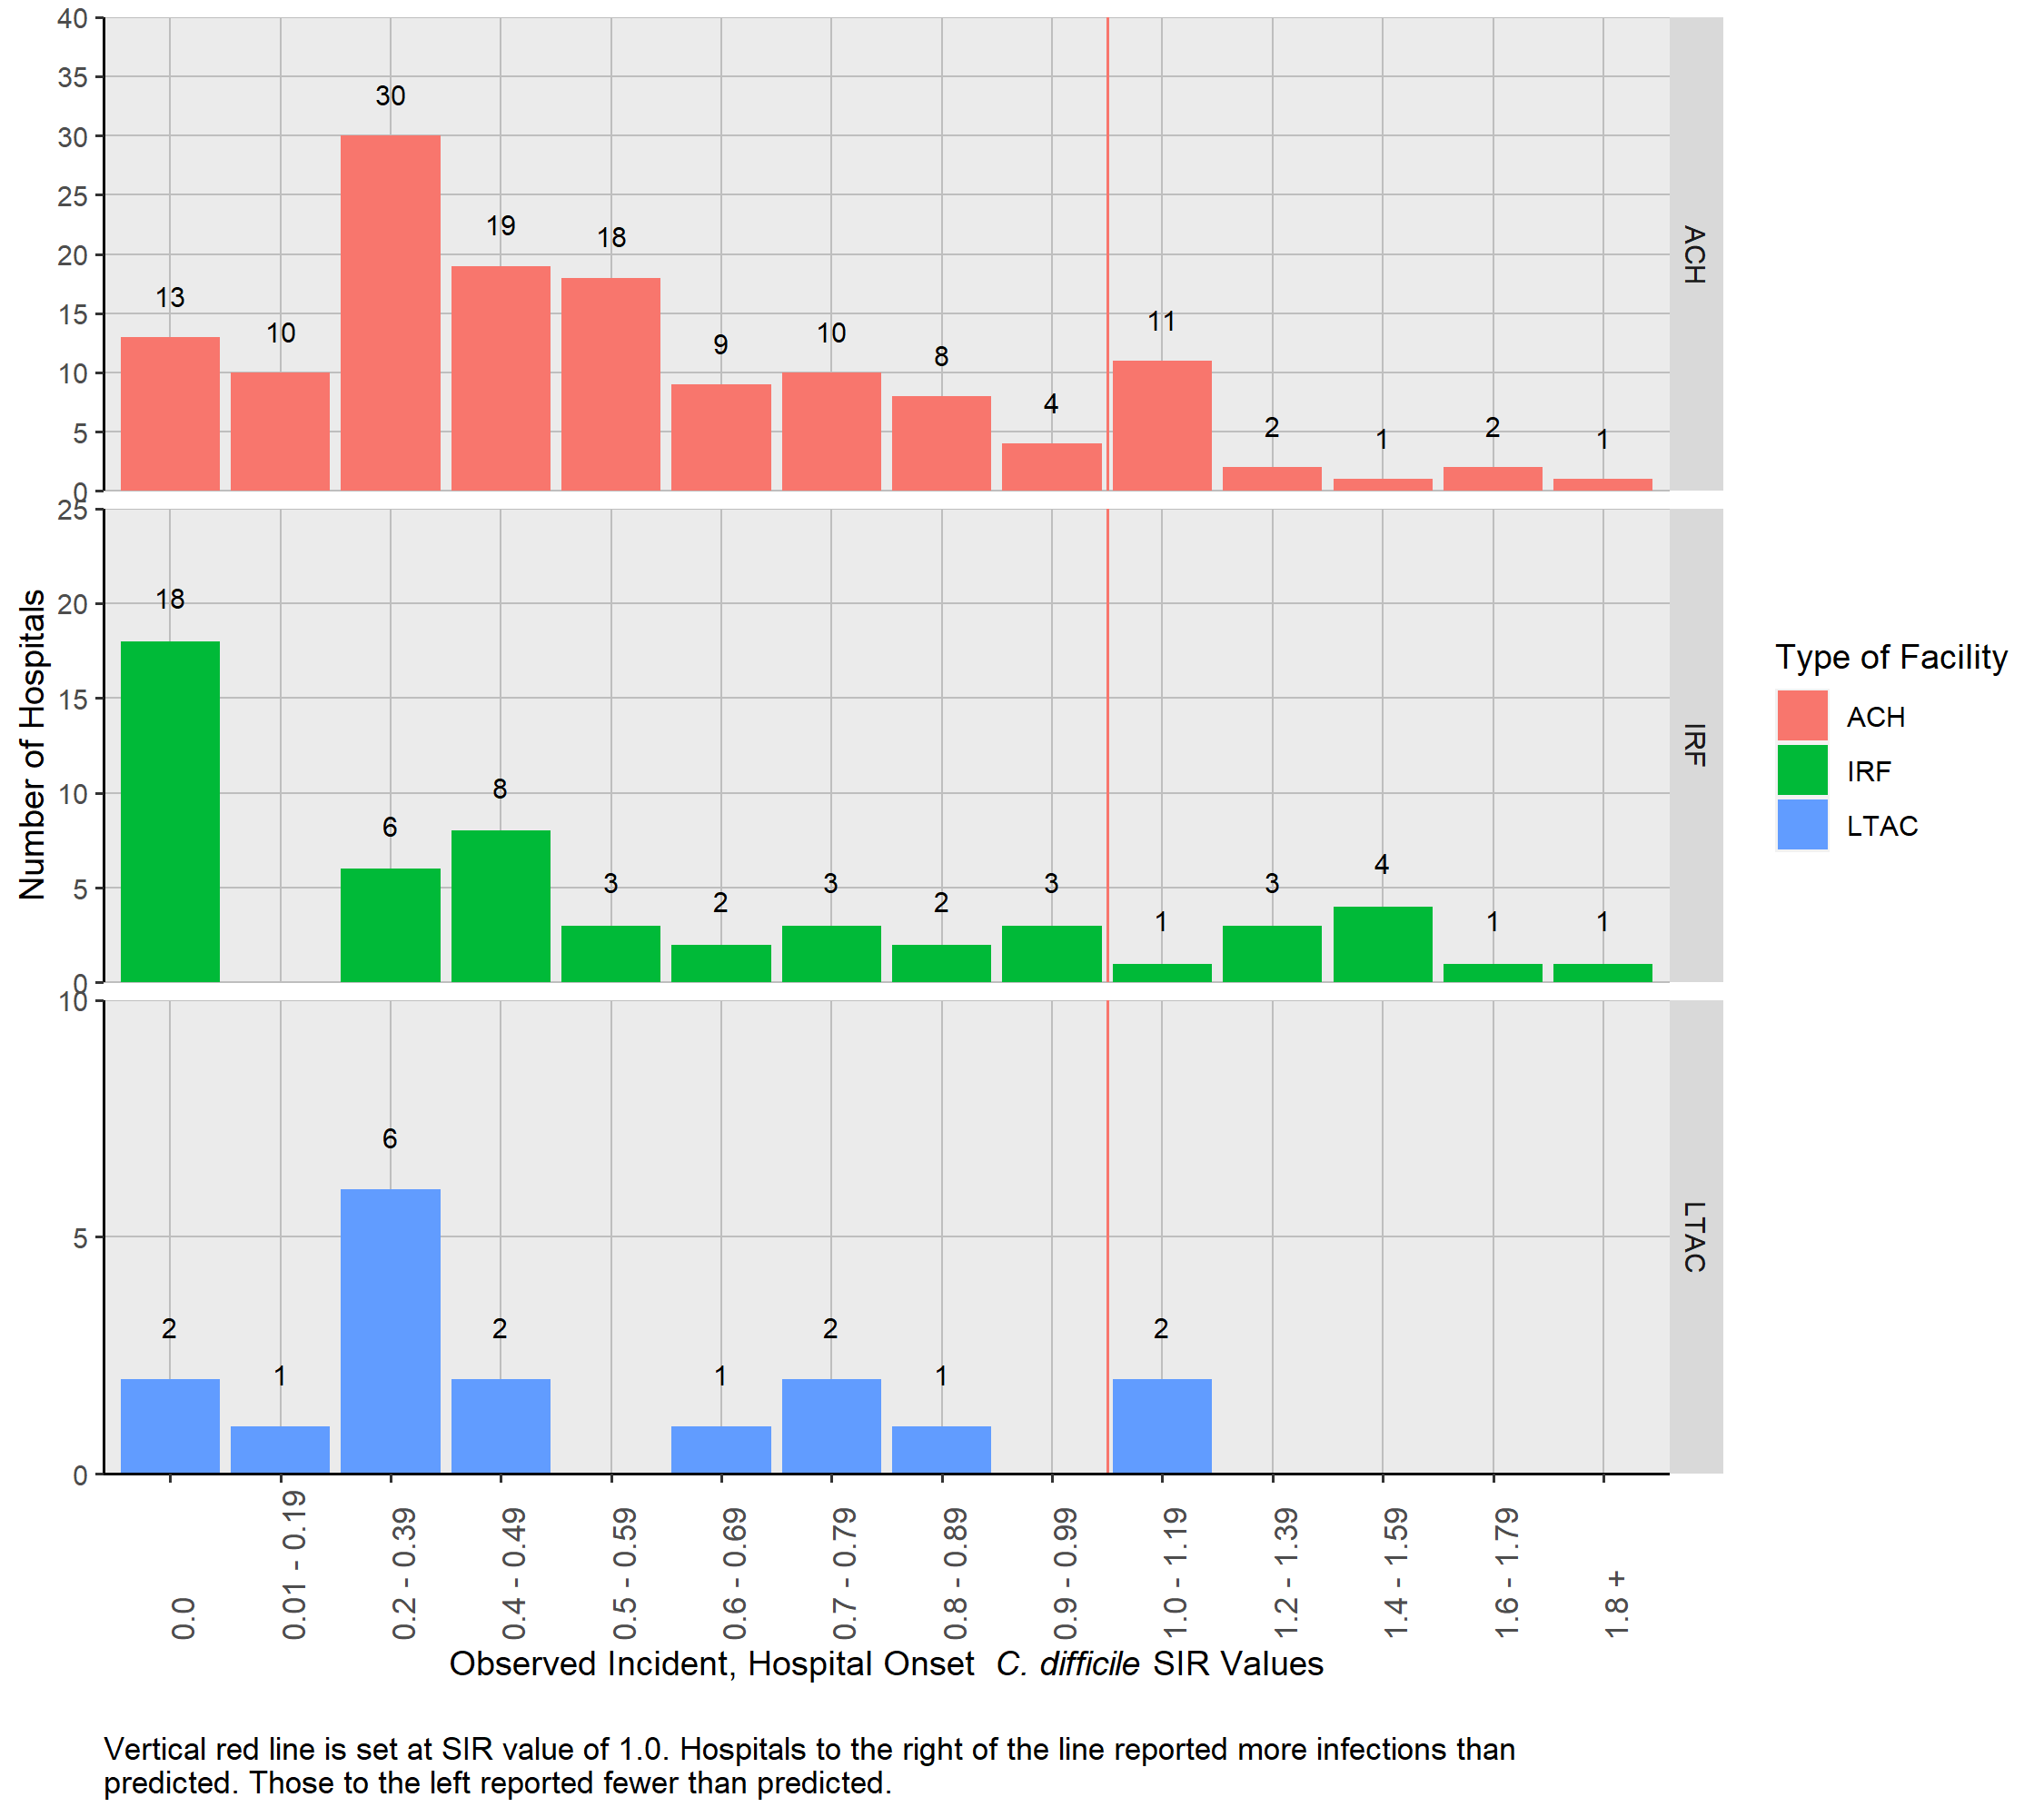
Figure 6 shows the distribution of CDI SIR values for ACH, LTAC hospitals, and IRFs among facilities with a SIR. The SIR values among the 210 hospitals with 1.0 or more predicted infections ranged from 0 to 2.91. The distribution among the ACHs shows that most SIR values (N = 0, NaN%) are less than 1.0. All but two LTAC hospitals have a SIR value less than 1.0 (N = 15, 88.2%). Eighty two percent (N=45) of IRFs have a SIR value less than 1.0.
Figure 6: Distribution of C. difficile SIRs Stratified by Hospital Type| Pennsylvania, 2021
4.6.3 Number of CDI LabID Events Among Hospitals With Less Than One Predicted Infection
For facilities that had less than 1.0 predicted CDI LabID event based on the 2015 national baseline data, a SIR could not be calculated. These facilities as well as the number of reported CDI LabID events are listed in Table 20. Although a SIR could not be calculated, these facilities can be evaluated with caution in light of the number of reported CDI LabID events. Of the 33 facilities with less than 1.0 predicted CDI LabID event, 26 reported zero infections. Although less than 1.0 CDI LabID event was predicted, three hospitals reported one infection, four hospitals reported two infections and zero hospitals reported three or more infections.
Table 20: Number (Percent) of Hospitals with Zero, One, Two, or Three or More CDIs Stratified by Hospital Type among those with Less Than One Predicted Infection | Pennsylvania, 2021| Hospital Type | Number of Hospitals | Zero | One | Two | Three or more |
|---|---|---|---|---|---|
| ACH | 21 | 18 ( 85.7 %) | 1 ( 4.8 %) | 2 ( 9.5 %) | 0 ( 0 %) |
| IRF | 12 | 8 ( 66.7 %) | 2 ( 16.7 %) | 2 ( 16.7 %) | 0 ( 0 %) |
| Total | 33 | 26 ( 78.8 %) | 3 ( 9.1 %) | 4 ( 12.1 %) | 0 ( 0 %) |
4.6.4 CDI LabID Event Measures by Hospital
Table 21 shows the number of CDI events and SIR for each Pennsylvania hospital that reported data (N=243). The type of CDI tests used by hospitals in 2021 is included in this table as a courtesy for facilities to evaluate CDI test methods used by their peers. The statistical models adjust for type of CDI test that was performed for each quarter of the year.
Thirty-three hospitals had a SIR of 0.0, even though the number of predicted CDI events ranged between 1.0 and 13.8. Ninety-two hospitals (37.9%) (identified by blue font) reported statistically significant SIR values that were less than 1.0, meaning that they had fewer CDI events than predicted by the 2015 national baseline. Fourteen of these hospitals reported no CDI events, although the predicted number ranged between 3.1 and 13.8. Among the remaining 78 hospitals where at least one CDI event was reported, the range of predicted CDIs was between 5 and 165.5. Three hospitals had a statistically significant elevated SIR value, meaning that more CDI events were reported than predicted from the 2015 national baseline.
Table 21: List of Hospitals with CDI Event SIRs by Hospital Name | Pennsylvania, 2021
Hospitals printed in red reported statistically significantly more CDI events than predicted. Hospitals printed in blue reported statistically significantly fewer CDI events than predicted.
4.7 MRSA Blood Infections
In 2021, 507 MRSA bloodstream events were reported and 550.7 were predicted from the 2015 national baseline. The state MRSA SIR is 0.92 (95% CI: (0.84, 1.00)). Departmental guidance states that children’s hospitals, CAHs and IPFs are not required to report MRSA blood LabID events. The data reported here do not include MRSA bloodstream events from those facilities. To reach the 2030 HHS SIR goal of 0.50, an additional 232 MRSA bloodstream events needed to be prevented.
Of the 10 hospitals with the greatest number of predicted infections three had a statistically significantly lower SIR than the 2015 national baseline. The SIR values from the seven other hospitals were not statistically significantly different from the 2015 national baseline data. Together these seven hospitals reported 118 MRSA events. This is 23% of all MRSA events in the state and yet only 20% of the number predicted infections in the state were predicted to come from these hospitals. Cumulatively, these seven hospitals reported 45 more MRSA events in 2021 than were reported in 2020 and needed to prevent 62 infections to reach the 2030 HHS goal (SIR = 0.50).
4.7.1 MRSA LabID Event Measures by Type of Hospital
Table 22 lists the SIR values, as well as the predicted and reported number of MRSA LabID events for Pennsylvania hospitals in 2021 stratified by facility type. These data are presented based on the number of patient days. Larger facilities with more patients will have more patient days than smaller facilities and are predicted to have more MRSA bloodstream LabID events. Therefore, a higher number of patient days correlates with a higher number of predicted MRSA LabID events.
Acute care hospitals performed 5% better than predicted by the 2015 national baseline data. They were predicted to have 513 MRSA events, but only reported 486. Their SIR value was not statistically significant (SIR: 0.95; 95% CI: (0.86, 1.03)). The same was true for IRFs that also reported 6% fewer MRSA LabID events than predicted (SIR: 0.94; 95% CI: (0.49, 1.64)). Long-term acute care hospitals were the only facility type to report a statistically significant reduction in MRSA LabID events when compared to 2015 national baseline data. They reported 61% fewer MRSA LabID events than predicted (SIR: 0.39; 95% CI: (0.20, 0.70)).
Table 22: MRSA Blood Infections SIRs by Hospital Type | Pennsylvania, 2021
4.7.2 Distribution of MRSA LabID Event SIR Values by Type of Hospital
Figure 7 shows the distribution of MRSA LabID SIR values for ACHs and LTAC hospitals. All of the IRFs (N = 68) had less than 1.0 predicted infection and are not presented in this table. The SIR values among 106 hospitals shown below range from 0.0 to 3.84. The distribution among the ACHs shows that slightly more than half of the SIR values (N= , %) are less than 1.0.
Figure 7: Distribution of MRSA Blood Infection SIRs Stratified by Hospital Type| Pennsylvania, 2021

4.7.3 Number of MRSA LabID Events Among Hospitals With Less Than One Predicted Infection
For facilities that had less than 1.0 predicted MRSA LabID event based on the 2015 national baseline data, a SIR could not be calculated. These facilities as well as the number of reported MRSA LabID events are listed in Table 23. Although a SIR could not be calculated, these facilities can be evaluated with caution in light of the number of reported MRSA LabID events. Of the 137 facilities with less than 1.0 predicted MRSA LabID event, 110 reported zero infections. Although less than 1.0 MRSA LabID event was predicted, 19 hospitals reported one infection, six hospitals reported two infections and two hospitals reported three or more infections.
Table 23: Number (Percent) of Hospitals with Zero, One, Two, or Three or More MRSA LabID Events Stratified by Hospital Type among those with Less Than One Predicted Infection | Pennsylvania, 2021| Hospital Type | Number of Hospitals | Zero | One | Two | Three or more |
|---|---|---|---|---|---|
| ACH | 65 | 49 ( 75.4 %) | 9 ( 13.8 %) | 5 ( 7.7 %) | 2 ( 3.1 %) |
| LTAC | 5 | 4 ( 80 %) | 1 ( 20 %) | 0 ( 0 %) | 0 ( 0 %) |
| IRF | 67 | 57 ( 85.1 %) | 9 ( 13.4 %) | 1 ( 1.5 %) | 0 ( 0 %) |
| Total | 137 | 110 ( 80.3 %) | 19 ( 13.9 %) | 6 ( 4.4 %) | 2 ( 1.5 %) |
4.7.4 MRSA LabID Event Measures by Hospital
Table 24 includes data from 243 hospitals. Thirty-three hospitals had a SIR of 0.0. The number of predicted MRSA LabID events ranged between 1 and 4.8 in those facilities. Five hospitals (identified by blue font) had statistically significant SIR values that were less than 1.0, meaning that they reported fewer MRSA events than in the 2015 national baseline. One of these hospitals reported no MRSA LabID events. Four hospitals (identified by red font) had statistically significant SIR values that were more than 1.0.
Table 24: List of Hospitals with MRSA Blood Infection SIRs by Hospital Name | Pennsylvania, 2021
Hospitals printed in red reported statistically significantly more MRSA events than predicted. Hospitals printed in blue reported statistically significantly fewer MRSA events than predicted.